

How to Prove ROI on AI Visibility Work

Nine months into the engagement, the client asks the question you knew was coming. What did we get for this, exactly?
For link building you have an answer. For rankings you have an answer. For AI visibility work, most agencies reach for a screenshot of a flattering ChatGPT response and hope the room nods.
It usually does nod. It nods for about one renewal cycle.
This post is about building the other kind of case: the one where you can show what changed, when it changed, and what it cost, without inventing a revenue number you cannot defend. It covers what your existing analytics can and cannot prove, how to set a baseline that still holds up in month nine, the four movements worth reporting, and three bridges from movement to money that survive a skeptical finance person.
AI visibility ROI is the measurable movement between a baseline reading of how AI engines represent a brand and a later reading of the same measures, set against what the work cost. It is a comparison, not a snapshot. A brand appearing in an answer today proves nothing on its own. A brand appearing today where it was absent six months ago is the entire case.
That distinction is the whole job. Everything below is about protecting it.
Why the old ROI math does not survive the handoff
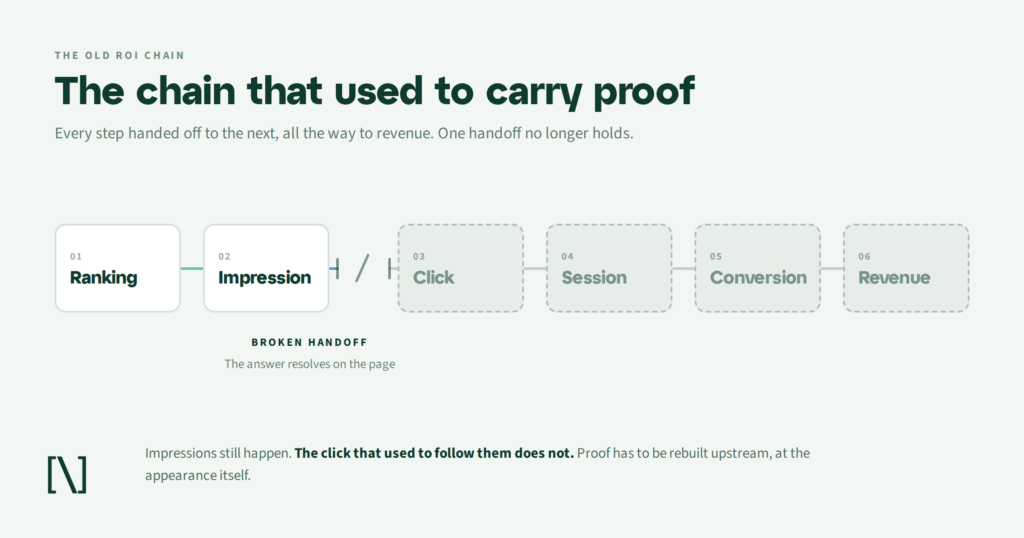
The traditional model is a chain. Ranking produces impression, impression produces click, click produces session, session produces conversion, conversion produces revenue. Every link is countable, which is why the model lasted twenty years and why every reporting template in your agency is built on it.
AI answers break the chain at the second link.
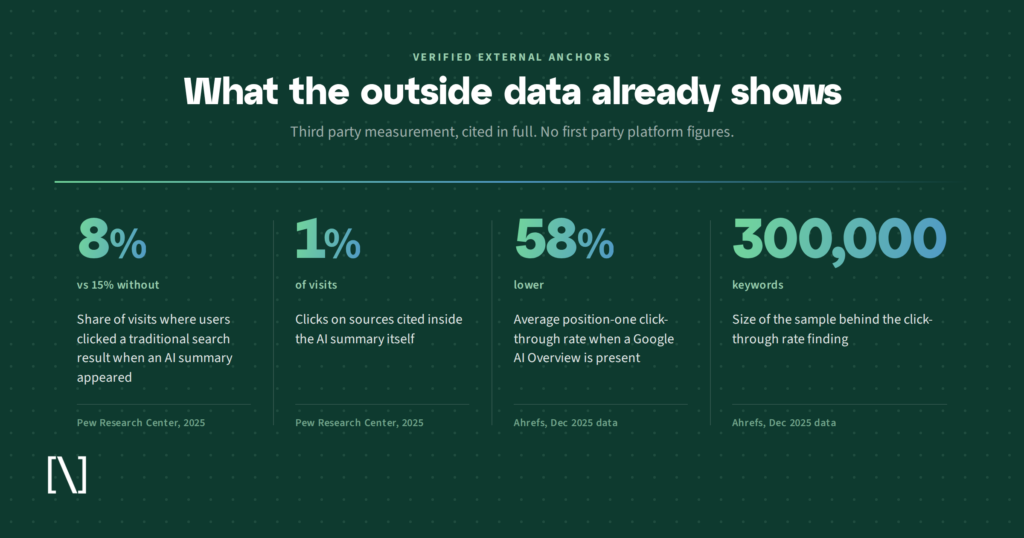
Pew Research Center tracked the browsing behavior of 900 US adults across nearly 69,000 Google searches and found that users clicked a traditional search result in 8% of visits where an AI summary appeared, compared with 15% of visits without one. Clicks on the sources cited inside the summary itself happened in 1% of visits.
Ahrefs re-ran its click-through study across 300,000 keywords using December 2025 data and found that the presence of a Google AI Overview correlated with a 58% lower average click-through rate for the top-ranking page, up from the 34.5% gap the same team measured in April 2025.
Read those two findings together and the implication for reporting is uncomfortable. The value your work creates has moved upstream of the click, into the answer itself, where your analytics platform has no visibility at all.
A brand can be present in the answer, described accurately, and named alongside the right competitors, and still hand you a flat traffic line at the end of the month. That brand is scenery. Scenery generates no session for you to count.
Which means that if your ROI model counts only sessions, the work will look like it failed in precisely the cases where it worked. Worse, it will look like it succeeded in the cases where a competitor’s answer sent a confused visitor your way once. You are not measuring the wrong thing badly. You are measuring a different thing entirely.
What your existing tools can prove, and where they stop
Start with what you already have. A real chunk of the case is sitting in tools the client already pays for, and there is no reason to build measurement you can get for free.
Google shipped a dedicated generative AI performance report in Search Console in June 2026. It is a genuine addition to the reporting kit, and worth switching on for every client property that has access to it.
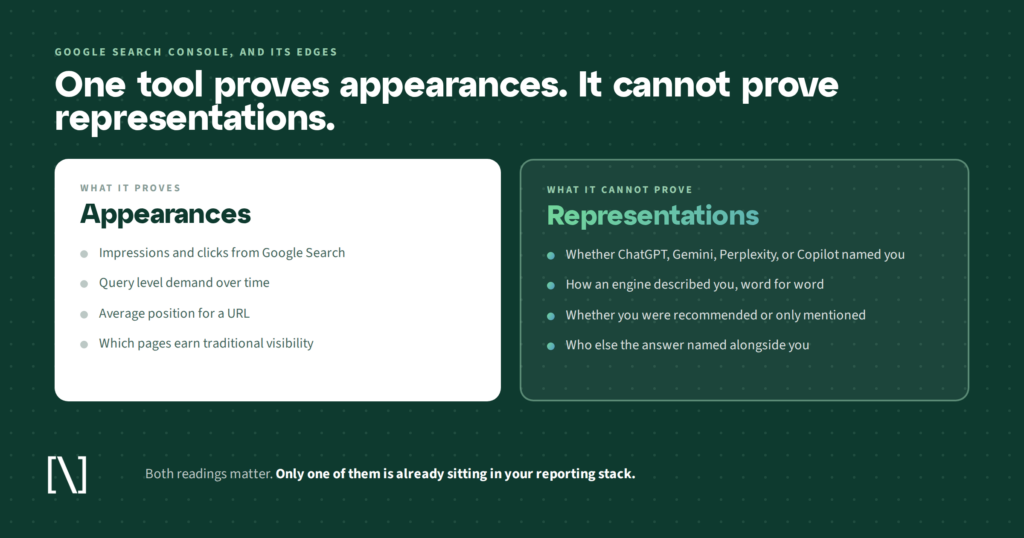
Here is what it gives you. The report shows impressions for Google AI Overviews and AI Mode, grouped by page, country, date, or device, with an export button and the same thousand-row limit as the standard performance report. Google notes that it is rolling out to a subset of properties, so some clients will not see it yet, and a missing report is not the same as a missing footprint.
Here is where it stops. There are no clicks, no click-through rate, and no query dimension. It covers Google surfaces only, which leaves ChatGPT, Gemini, Perplexity, and Copilot entirely unaccounted for. And it counts appearances, not descriptions.
That last gap is the one that decides ROI. Impressions count appearances; ROI is made of representations. The report can tell you that a page was surfaced inside an AI feature. It cannot tell you whether the answer recommended the client, listed the client fourth among six options, or named the client on the way to steering the reader somewhere else.
Your analytics platform closes a little of the remaining gap. Referral traffic from AI assistants can be pulled into its own channel grouping, and that segment is worth building on day one of any engagement, because a channel you define in month six has no history. Size it accurately when you present it, though. It measures only the small share of people who clicked, which the Pew figures put in the single digits.
So the existing stack proves reach on one family of surfaces, plus traffic from a thin slice of users. That is a useful floor and a bad ceiling. Everything above it has to come from measurement you set up deliberately, which brings us to the step most engagements skip.
Draw the starting line before you touch anything
The most common reason an agency loses the ROI argument is not weak results. It is that nobody wrote down where the client started.
Without a starting line there is no movement, only a current state, and a current state is indistinguishable from luck. In month nine you will be arguing that a good answer is your doing, in front of a client who has no particular reason to believe the answer was ever different.
A baseline worth keeping records six things, captured on the same day and dated:
- The prompt set. The actual questions the client’s buyers ask, written the way a buyer would type them rather than the way a marketer would. Twenty to forty questions covers most engagements.
- Presence by engine. Whether the brand appears at all, checked separately across ChatGPT, Gemini, Perplexity, Copilot, and Google AI Overviews. Engines disagree with each other constantly, and an average across them hides the disagreement that matters.
- Standing in the answer. Named or listed, first or fifth, recommended or mentioned in passing. This is the job AI Share of Voice does with a single number.
- Citation type. Whether the engine linked to the client or only said the name out loud. The distance between those two outcomes is the subject of the citation footprint.
- Repeated language. The strengths, weaknesses, and objections the engines keep returning to, captured close to verbatim so you can compare phrasing later, not just sentiment.
- The competitive set. Which other brands turn up in the same answers, which is the raw material for any later AI competitive analysis.
Then freeze the prompt set. This is the rule people break most often and regret most.

If you add sharper questions in month four, you have changed the ruler. Every comparison after that measures your prompt edits as much as the client’s progress, and a client who spots it will discount the whole report. Keep the original set fixed as the scoreboard and run new questions as a separate exploratory list. Nothing stops you from reporting both, as long as you never blend them.
If you already skipped the baseline, you have two honest options and no third one.
Declare a new starting line today and report against the shorter window it gives you. Or use the original audit deck as a qualitative anchor, setting what the engines said then against what they say now, and label it in the report as qualitative.
What you cannot do is reconstruct a baseline after the fact and present it as measurement. Someone will eventually ask how you know, and the answer will be that you do not.
The four movements worth reporting
Once the starting line exists, ROI reporting becomes a comparison exercise. Four movements carry nearly all of the signal, and a report that covers these four consistently beats a report that covers twelve occasionally.
Presence. Did the brand start appearing in answers where it was previously absent? This is the coarsest measure and the easiest for a client to grasp without a preamble, which makes it the right one to lead with. It is also the one that moves first, since going from nothing to something is a lower bar than going from fourth to first.
Standing. Among the answers where the brand already appeared, did it move from being one name in a list to being the answer? A brand that goes from scenery to recommendation may not have gained a single impression, and has gained everything. Standing is slower to move than presence and worth more when it does.
Citation quality. Did name-only mentions turn into linked citations, and did the sources carrying those citations improve? One citation from a trade publication the engines already lean on outweighs three from aggregators, and it holds up better across model updates. Report the source names, not just the count.
Representation. Did the recurring objections shrink? If the engines used to open with a pricing concern or a support complaint and now open with a capability, that is a real change in how every buyer meets the brand before a salesperson gets involved. In practice this is often the single most valuable slide in the deck, because it is the one the client’s executives react to physically.
For all four, report direction rather than decimals. On a thirty-prompt set, “present in eleven of thirty, up from four” is honest and legible. “36.7%, a 175% improvement” is precision theater on a sample that cannot support it, and it invites the one question you do not want in that meeting.

Three honest bridges from movement to money
Movement is not money, and the fastest way to lose a room is to pretend the gap between them is smaller than it is. Three bridges hold up under pressure.
Cost per answer earned. Take the retainer for the period and divide it by the number of buyer questions where the brand moved from absent to present. This is not revenue and you should not call it revenue. It is a unit economic, and it gives the client something to weigh against what reaching the same buyer through paid placement would cost. Finance people who cannot do anything with a visibility score can usually do something with this.
Downstream demand signals. If presence grew across the discovery-stage prompts, watch branded search volume and direct traffic over the following quarter. When they move together, show both lines and say plainly that it is correlation. You are demonstrating a pattern consistent with the work, not proving the work caused it, and the distinction costs you nothing to state.
Evidence from sales conversations. Ask the client’s sales team two questions. Are prospects arriving already familiar with the brand from an AI assistant? And has the objection they open with changed? An executive who hears a rep say that buyers stopped leading with a concern the engines used to repeat will find that more persuasive than any chart you can build, and it costs you a fifteen-minute call to collect.
None of these is a clean attribution chain, and your report should say so in one sentence rather than leaving the client to work it out. Credibility spent on an overclaim comes out of the parts that were true.
Build the report the client will read
Keep it to one page, and keep it identical every time.
Same four movements, same order, same visual. A client learns to read a consistent report in about two cycles, and after that the reading takes ninety seconds and the meeting is about decisions instead of orientation. A report that gets redesigned every quarter never crosses that threshold, no matter how good each version looks.
Run it monthly for movement and quarterly for the full read, including the representation section and the competitive set. Movement between two consecutive months is usually noise. Movement across a quarter is usually real.
Structure the page as a ledger. Left column, the baseline. Right column, today. Underneath, two short lists: what shipped this period, and what moved. Then annotate the timeline with ship dates, so a jump has a cause sitting next to it rather than a cause you assert three slides later.
That annotation habit is what turns a report into an argument. It also happens to be the reporting layer of the measure, do, prove loop that lets AI visibility run as a productized service instead of a string of one-off audits. The measuring is not overhead attached to the work. On this kind of engagement, the measuring is a large part of what the client is buying.
Five mistakes that sink the ROI case
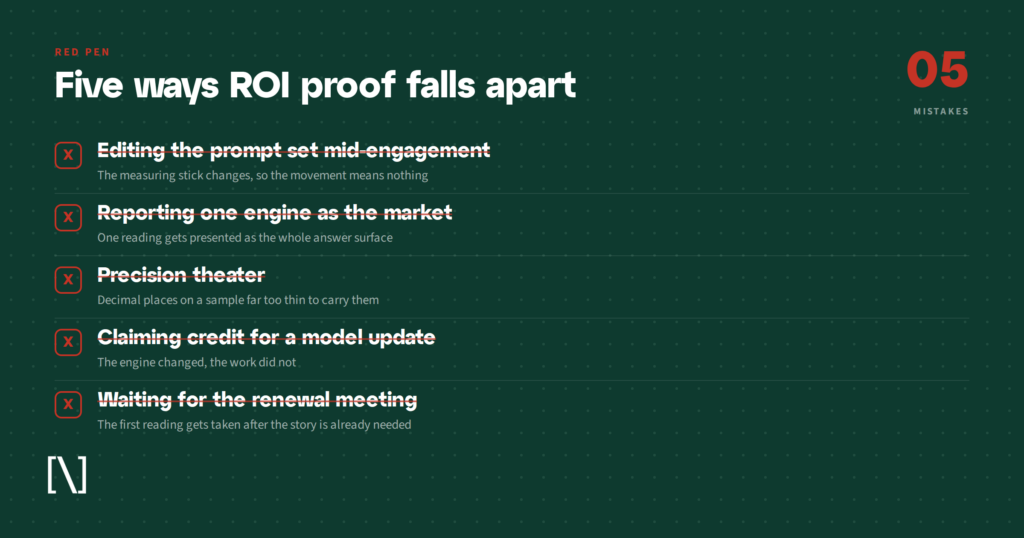
Editing the prompt set mid-engagement. Covered above, and worth repeating because it is the mistake that quietly invalidates everything built on top of it.
Reporting one engine as if it were the market. ChatGPT alone is a partial view. A client who opens Perplexity on their phone during the meeting will discover the gap before you do, and you will spend the rest of the hour on the back foot.
Precision theater. Decimal places on a small sample read as confidence to nobody who understands samples, and they read as evasion to everyone else.
Claiming credit for a model update. Engines change on their own schedule, and some of your best months will not be your doing. A jump you did not cause is a jump you cannot defend when it reverses, and it will reverse in front of the same client.
Waiting for the renewal meeting. ROI reporting that begins when the contract comes up for review looks exactly like what it is. The case has to accumulate in the client’s inbox month by month, so that by the time anyone asks the question out loud, it has already been answered eight times.
Frequently asked questions
How long before AI visibility work shows measurable movement?
Plan on one to two quarters before a comparison is worth putting in front of a client. Content and citation changes have to be crawled, retrieved, and reflected in generated answers, and answers vary between runs even when nothing has changed, so a short window mostly measures that variance. Report the work shipped in month one and hold the movement claims until you have a quarter of readings behind them.
Can you attribute revenue directly to AI visibility?
Not through a clean chain, and any tool that claims otherwise is modeling rather than measuring. Most of the value lands before the click, where no analytics platform can observe it. Cost per answer earned, downstream demand signals, and evidence from sales conversations are the strongest honest substitutes, and presenting all three together is more convincing than presenting one confidently.
What if the client’s traffic drops while AI visibility rises?
That combination is common and, given the click-through research above, expected. Show both lines together and explain the mechanism: the same answer that made the brand visible also resolved the reader’s question on the results page. This is the moment a baseline earns its keep, because without one the traffic line is the only story anyone in the room can tell.
How many prompts belong in a baseline?
Twenty to forty covers most engagements. Below twenty, ordinary answer variation swamps the signal. Much above forty, the set becomes expensive to re-run at the cadence you need, and cadence matters more than breadth. Prioritize questions with buying intent over questions with volume, since a handful of high-intent prompts do more for a client’s pipeline than a long list of informational ones.
Where to start
If you are mid-engagement without a baseline, set one this week. The comparison you can start today is worth more than the one you keep meaning to build.
If you are scoping a new engagement, put the baseline in the first deliverable and the reporting cadence in the contract. It costs a day, and it decides whether the renewal conversation is a defense or a formality.
To see what a starting-line reading looks like for a brand, run a Report Card. The measures behind it are documented on our platform. And if you would rather talk through how this fits a specific book of clients, here is how we help.
Related Articles
You ask an engine a question in your category. Your brand comes up. That feels like a win, right up…


Most teams working on AI visibility end up holding two reports that never quite meet. One is a keyword export.…

A client forwards you a screenshot. They asked ChatGPT which provider to use in their category, and a competitor came…