
Market Atlas: Where Your Brand Appears, and Who Appears With You

You ask an engine a question in your category. Your brand comes up. That feels like a win, right up until you read the answer a second time and notice you are one of five names in a single sentence, and the sentence is really about somebody else.
That gap between showing up and being chosen is the whole problem. Most teams measuring AI visibility today are counting appearances and calling it coverage. Counting is the easy part. The harder question is what the answer was shaped like when your name landed in it, and who else was standing there.
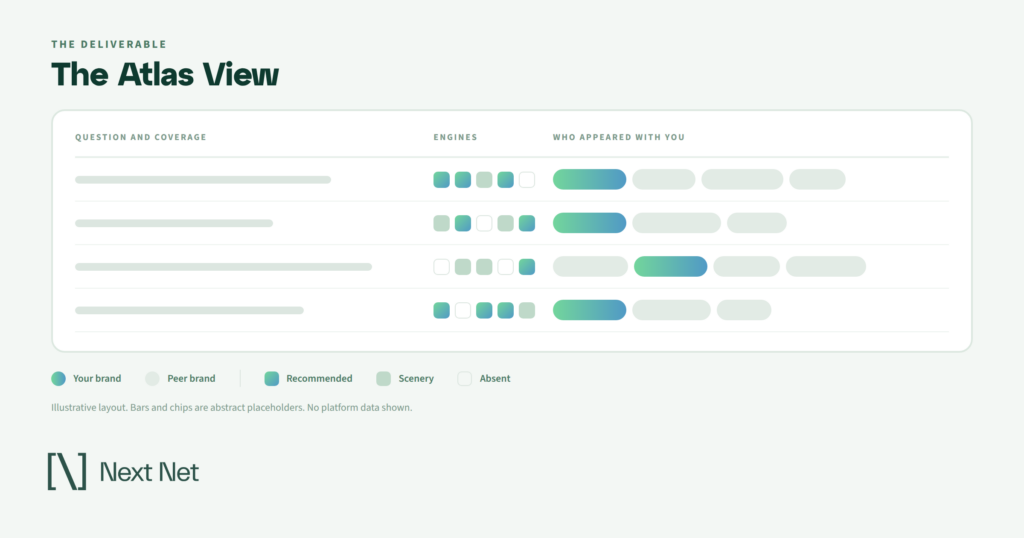
A Market Atlas is a map of two things at once: every place your brand surfaces across the questions buyers ask an AI engine, and every other brand that surfaces alongside you in those same answers. The first half is coverage. The second half is company. Read together, they tell you not just whether you show up, but what the engine has decided you are.
This post covers what the atlas maps, why coverage is not the same document as your rankings report, how to read co-appearance as positioning intelligence, and how to build the tracking yourself if you want to start before you buy anything.
The two halves of the map
Coverage is the part most people expect. Across a defined set of buyer questions, where does your brand surface, on which engines, and how often? That gives you a shape: dense in some corners of your category, thin in others, absent in a few you assumed you owned.
Company is the part nobody expects, and it is the more useful half.
When an engine answers a question like “what should I look for in a vendor for X,” it rarely returns one name. It returns a set. That set is a judgment. The engine has grouped you with a specific handful of other brands, and it made that grouping without asking you, without reading your positioning deck, and without any regard for the peer set your marketing team decided on two years ago.
Co-appearance is that grouping made visible. It is the closest thing you can get to a direct answer to the question “who does the market think we are like?”

Coverage is not your rankings map
It is tempting to assume that if you rank well, you appear well, and that a rankings report is a reasonable proxy for an appearance map. The overlap is real but partial.
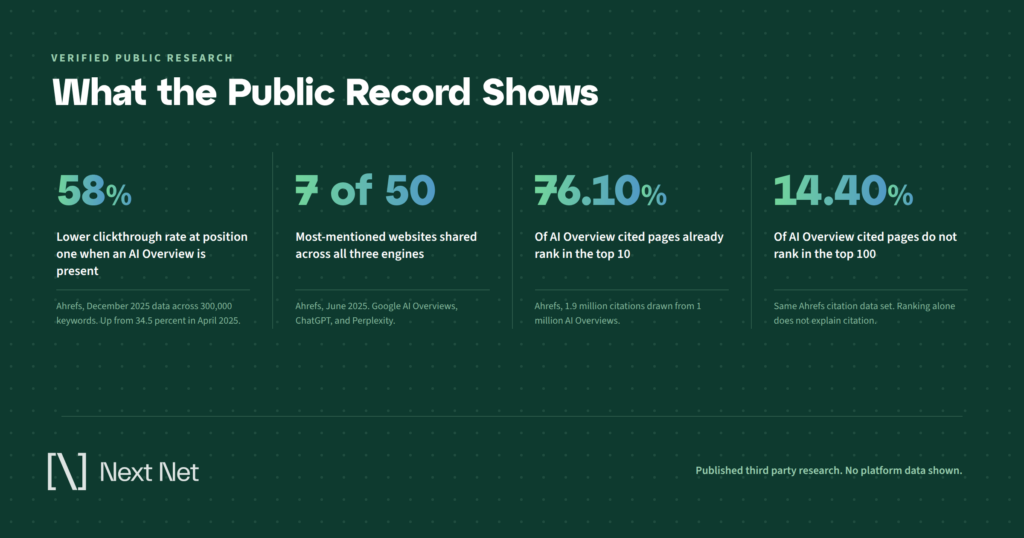
An Ahrefs analysis of 1.9 million AI Overview citations found that 76.10% of cited pages ranked in the top 10, 9.50% ranked somewhere between positions 11 and 100, and 14.40% did not rank in the top 100 at all. Most of what gets cited is content that was already doing well in search. A meaningful slice is not.
Google’s own position is consistent with that. Its guide to optimizing for generative AI features on Google Search states that SEO best practices remain relevant because the generative AI features in Search are rooted in the core Search ranking and quality systems, and its AI features and your website documentation says plainly that there are no additional requirements to appear in AI Overviews or AI Mode and no special optimizations necessary.
So the two maps rhyme. They are not the same map. Your rankings report tells you where your pages sit. Your atlas tells you where your name lands, which includes answers assembled from pages that never ranked, from third-party listicles you did not write, and from category explainers where you are cited as an example rather than a destination.
If you only look at the rankings map, you will miss the places where you are present as scenery: named, accurate, entirely beside the point.
Reading co-appearance as positioning intel
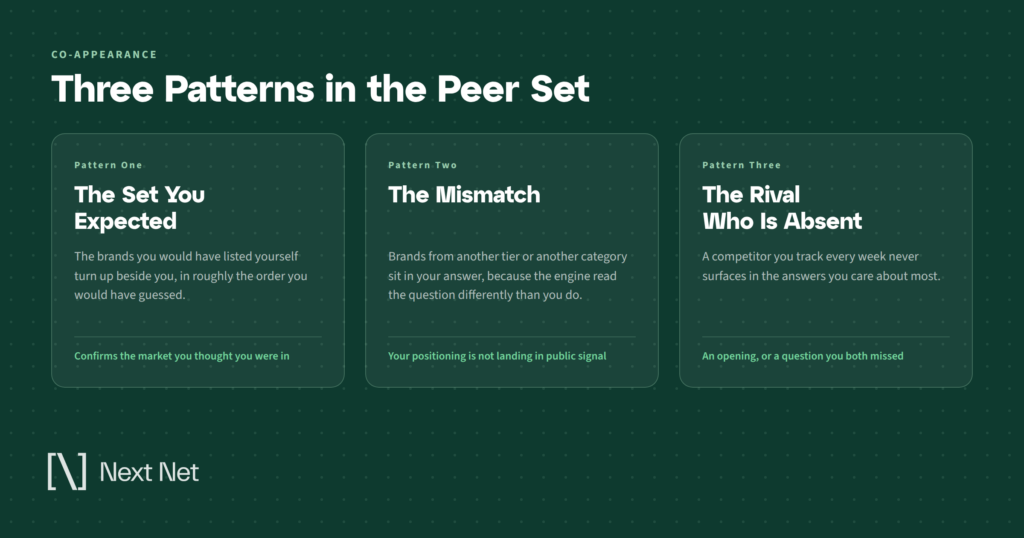
Once you have the co-appearance data, three patterns tend to surface. Each one means something different, and each one calls for a different response.
The peer set you expected. You appear alongside the brands you already benchmark against, in roughly the proportions you would guess. This is the boring result and it is good news. It means the engine’s model of your category matches yours, and your positioning work is landing. Note it and move on.
The mismatch. You appear consistently next to brands you do not consider competitors. Maybe they serve a different segment, sit at a different price tier, or solve an adjacent problem. This is the finding worth an internal meeting. The engine has assembled its view of you from public signal: your site copy, the way third parties describe you, the categories you get listed in. When the grouping is wrong, that public signal is telling a story your team did not intend to tell.
The rival who is not there. You expected to see a particular competitor in the set and they are missing. Two readings are possible. Either the engine does not associate them with this question, which is an opening, or the question is framed in a way that favors your side of the category. Both are worth knowing before you brief a content team.
Here is what the mismatch looks like in practice. Imagine a mid-market services firm that has spent two years positioning itself as the sophisticated option for complex accounts. It runs its question set and finds that across the buying questions that matter most, it appears reliably, and almost every time it appears next to three low-cost, self-serve providers. Nobody at the firm considers those companies competitors. The engines do.
Tracing it back, the cause is rarely mysterious. A few widely cited comparison pages put all four brands in the same table under a heading about affordable options. Those pages get retrieved constantly, and every retrieval reinforces the grouping. The firm’s own site never uses the vocabulary that would signal the tier it thinks it occupies, so there is nothing in the public record pulling the other way.
That is a fixable problem, and it is a problem you cannot see from a rankings report, a traffic dashboard, or a brand survey. It only shows up when you look at who is standing next to you in the answer.
None of these three patterns tells you what to do on its own. They tell you where to look. Positioning work is still positioning work, and no map has ever written a message for anyone.
The map changes depending on which engine you ask
A single-engine read is a single-engine read. It is not a market view, and treating it as one is the most common way teams end up confidently wrong.
The systems retrieve differently. Ahrefs compared the 50 most-mentioned websites across Google AI Overviews, ChatGPT, and Perplexity for June 2025 and found that only 7 sites appeared in the top 50 for all three, across roughly 76.7 million AI Overviews, 957,000 ChatGPT prompts, and 953,500 Perplexity prompts. The overlap between those three systems was small enough to make the point on its own.
That study looked at source domains rather than brand mentions, and it covered three systems rather than the full set. The mechanism it points at holds more broadly. Different retrieval methods, different training corpora, and different licensing arrangements produce different answer sets for the same question.
This is why an atlas worth reading covers ChatGPT, Gemini, Perplexity, Copilot, and Google AI Overviews rather than sampling whichever one your team happens to have open. Your co-appearance set on one engine may be a completely different cast on another, and the difference is itself the signal: consistent grouping across engines means the association is durable, while grouping that appears on one engine and vanishes on the others usually means a single influential source is driving it.
How to track brand mentions in AI search
You can build a rough version of this by hand before you commit to anything. It will not scale and it will not be precise, but it will tell you whether the full picture is worth paying for.
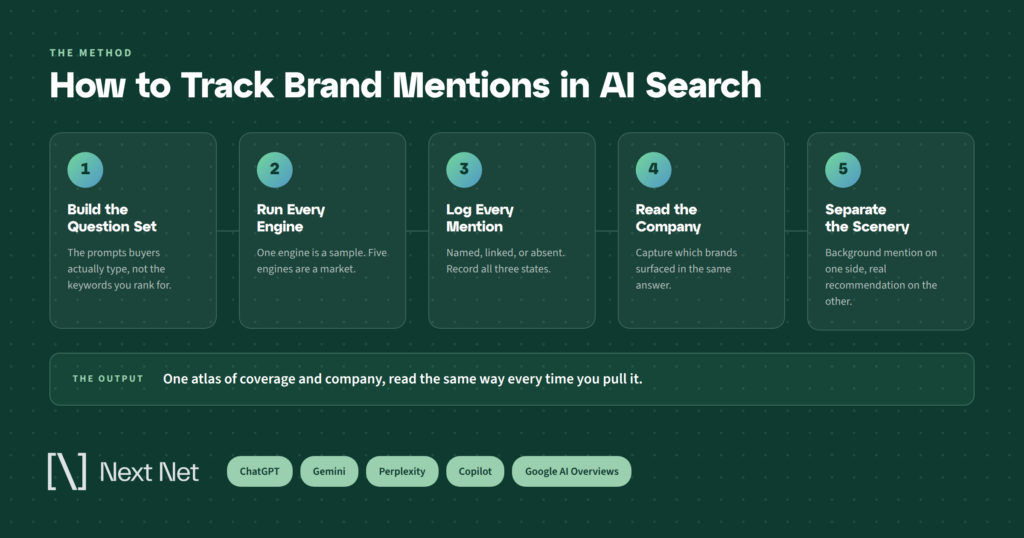
Start with real buyer questions, not keywords. Pull 25 to 40 questions from sales call notes, support tickets, and your own site search logs. Phrase them the way a person would type them into a chat window. “Best options for X for a mid-size team” beats “X software.”
Run the full set across all five engines. Same questions, same order, logged the same day. Use a clean session each time so personalization does not skew the results.
Log two things per answer, not one. First, whether your brand appeared. Second, and more important, the role it played: was it recommended, or was it mentioned in passing? Mentions are scenery; recommendations are revenue. A tracker that collapses those two into a single “visibility” count is throwing away the only part of the data that predicts anything.
Log every other brand in the answer. This is the co-appearance column and it is the one people skip. Capture the full set, not just the names you recognize.
Re-run on a schedule and read the direction, not the decimals. Answers move. With a sample of 40 questions you can see that a pattern is strengthening or weakening. You cannot responsibly say it moved 4.2%, and anyone quoting that kind of precision off a sample that size is selling you certainty they do not have.
One caveat on tooling. Google provides a generative AI performance report inside Search Console for its own surfaces, and its official optimization guidance warns site owners to be wary of third-party tools that promise ranking success or claim to use internal Google metrics, noting that no third-party tool has access to its internal ranking or AI systems. That warning is correct and worth repeating. What an atlas measures is observed output: what the answers said, on the record, when sampled. That is a different thing from internal ranking data, and any vendor blurring the two deserves a hard question.
What to do with the map once you have it
Three moves tend to follow, roughly in order of how quickly they pay off.
Fix the mismatch at the source. If the engine is grouping you with the wrong peer set, find the public content driving that association. Usually it is a handful of third-party roundups, comparison pages, or directory listings that describe you in terms you would not choose. Those are addressable through outreach, corrections, and earned placements, and they tend to move faster than trying to out-publish the problem.
Go after the corners where you are absent. Coverage gaps are cheaper to close than co-appearance problems are to fix. If there is a cluster of buyer questions where your name never surfaces and the answers are being assembled from three sources you could plausibly appear in, that is a content and placement brief that writes itself. Our post on which publications and site types AI trusts in your category goes deeper on picking those targets.
Convert scenery into recommendation. The hardest and most valuable move. Where you appear consistently but always as an also-mentioned, the constraint is rarely awareness. It is that nothing in the available public record gives the engine a reason to put you first for that specific question. That is a proof problem, and it responds to specifics: named outcomes, documented use cases, third-party validation with numbers attached.
Practically, this means auditing what the web can currently say about you and finding the gap. If every answer that recommends a competitor cites a page with concrete results and every answer that merely mentions you cites a page describing what you do in general terms, the difference is not visibility. It is evidence. Category pages and capability copy tell an engine what bucket you belong in; specifics are what move you from the bucket to the recommendation.
Work one question at a time here rather than trying to lift everything at once. Pick the three buyer questions closest to a purchase decision, look at what the answers currently cite, and build toward being citable for those three.
The stakes here are not abstract. Ahrefs re-ran its click-through study using December 2025 data and found that the presence of an AI Overview correlated with a 58% lower average clickthrough rate for the top-ranking page, up from the 34.5% it measured in April 2025. The answer surface is absorbing the click. Being in the answer, in the right role, is increasingly the whole game.
What the atlas will not tell you
Being clear about the limits is part of reading it correctly.
It will not tell you why. Coverage and co-appearance describe the shape of the answer, not the reasoning behind it. The language engines repeat about your strengths and objections is a separate read.
It will not settle a head-to-head. The atlas shows you who you are grouped with. Working out where you hold an advantage against one specific rival, question by question, is a different analysis with a different output. That is AI competitive analysis territory.
It will not give you one number to report. If your executive team wants a single line in the dashboard, the atlas is the wrong artifact. AI share of voice is the summary metric; the atlas is the map underneath it that explains why the number moved.
And it will not be stable week to week on a small sample. Answers vary. Read months, not Mondays.
Frequently asked questions
How is co-appearance different from a normal competitor list?
Your competitor list is the one you chose. Co-appearance is the one the engines assembled from public signal, without consulting you. When those two lists diverge, the divergence is the finding.
How many questions do I need before the data means anything?
Enough to see a pattern repeat, which in practice tends to start around 30 to 40 questions run across all five engines. Below that you are looking at noise. Above it you can start trusting direction, though not precision.
Does appearing in more answers always help?
No. Appearing more often in a role that does not drive consideration adds volume without adding pipeline. The role your brand plays in the answer matters more than the count of answers it appears in.
Can I just use Search Console for this?
Only for Google surfaces. The generative AI performance report covers Google’s own AI features and tells you nothing about how ChatGPT, Gemini, Perplexity, or Copilot are answering the same questions. The cross-engine picture requires cross-engine sampling.
How often should I refresh the map?
Monthly is a reasonable cadence for most categories. Fast-moving categories with heavy news coverage shift faster. The useful signal is the trend line across several refreshes, not any single pull.
Where to start
If you have never looked at this data, do not begin by buying a platform. Begin by running 30 questions across the five engines yourself and logging who shows up next to you. An afternoon of that will tell you more about your position than another quarter of guessing, and it will tell you whether the full map is worth the investment.
When you are ready for the continuous version, the Next Net AI platform runs the sampling on an ongoing basis across ChatGPT, Gemini, Perplexity, Copilot, and Google AI Overviews, and separates mentions from recommendations rather than collapsing them into a single count.
For agencies and partners building this into client work, here is how we help. And if you want a read on where a single brand stands right now, the Report Card is a free starting point.
Your brand is already on somebody’s map. The only question is whether you have seen it.
Related Articles
On August 31, 2026, Google finished rolling out a report that site owners had been asking about for two years.…

There is a number you have probably seen quoted in five different decks this year: 84% of AI citations come…

Most teams working on AI visibility end up holding two reports that never quite meet. One is a keyword export.…