
Sources: Which Publications and Site Types AI Trusts in Your Category

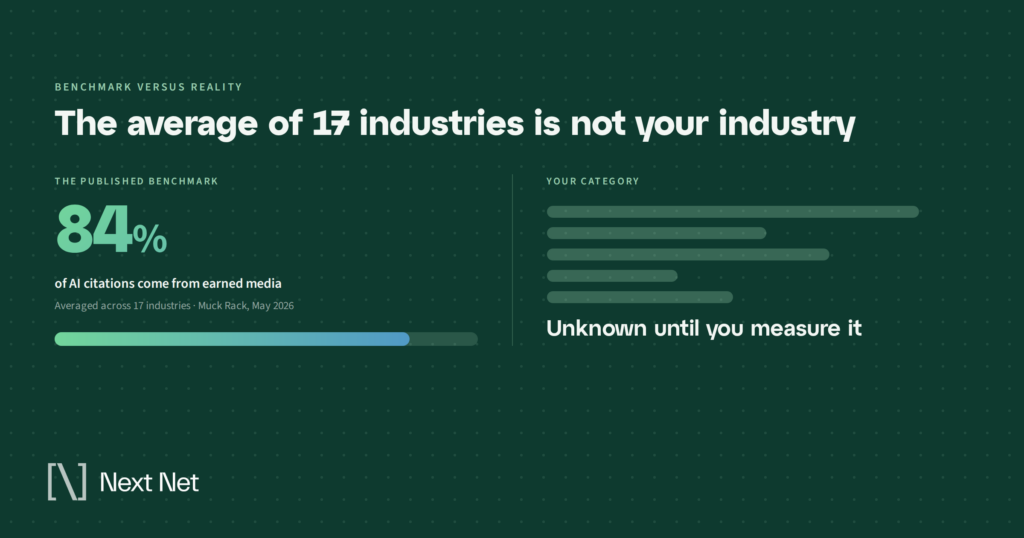
There is a number you have probably seen quoted in five different decks this year: 84% of AI citations come from earned media.
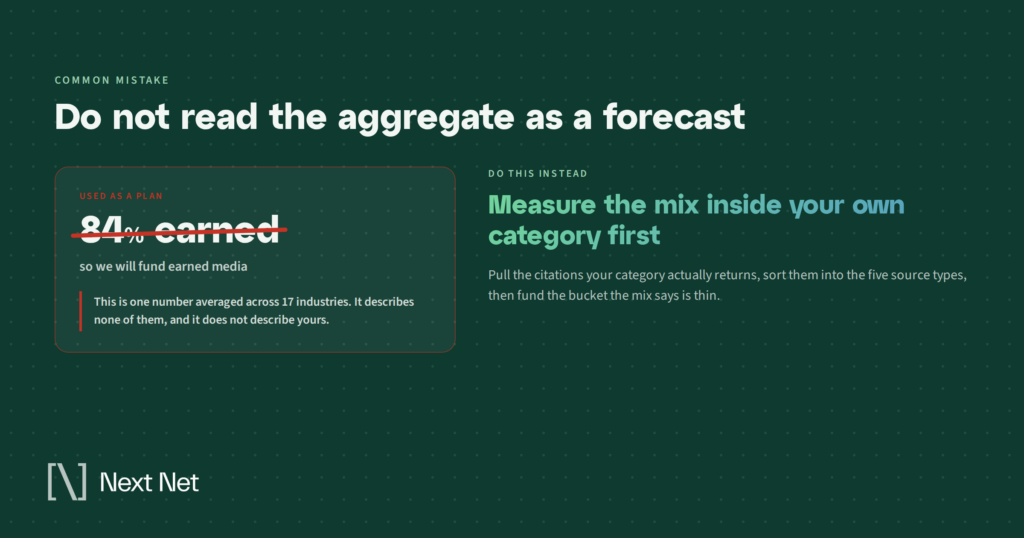
It is a real number from a real study. It is also close to useless as a planning input, because it describes the average of seventeen industries at once, and you do not sell into seventeen industries.
The useful version of that number is the one for your category. Which kinds of sites get cited when someone asks an AI engine a question you want to be the answer to. Which outlets show up repeatedly. Which ones never do, no matter how much you invest in them.
That distribution has a name, and it is the single most actionable thing you can pull out of AI visibility data.
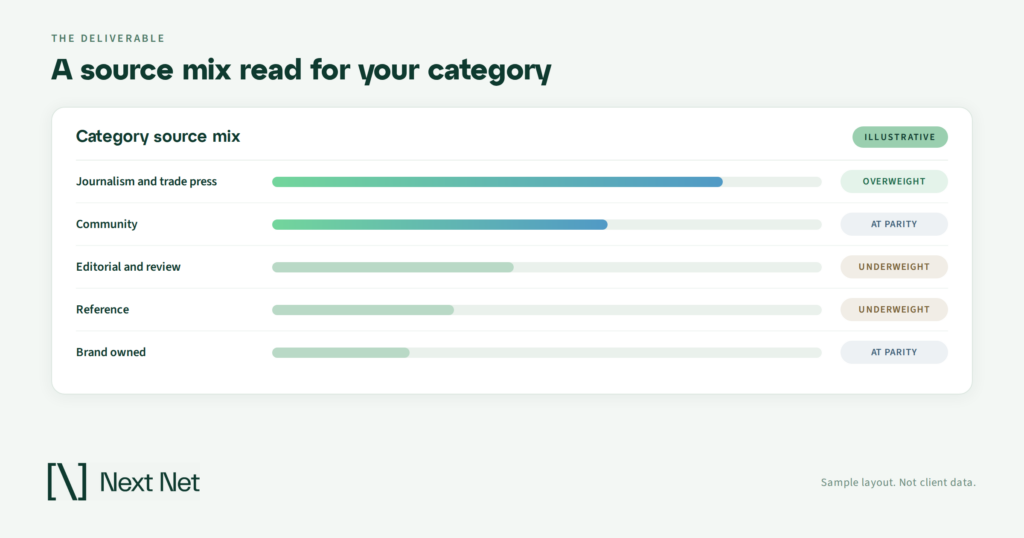
A source mix is the breakdown of what kinds of sites an AI engine cites when it answers questions in a given category, grouped by type: brand-owned pages, journalism and trade press, community and forum content, editorial reviews and comparisons, and reference sites. Read across a category, the mix tells you where citation authority is concentrated and where your investment will and will not compound.
This post is about how to read that mix and what to do once you have. It is not about tactics for earning individual citations, which is its own topic, and it is not about the mechanics of building third-party credibility, which is covered separately.
What a source mix is
Every AI answer is assembled, not retrieved. The engine runs searches, pulls candidate documents, decides which ones are worth leaning on, and writes an answer that leans on them.
The set of documents it leaned on is the citation list. Roll that up across hundreds of questions in your category, group the domains by what kind of site they are, and you have a source mix.
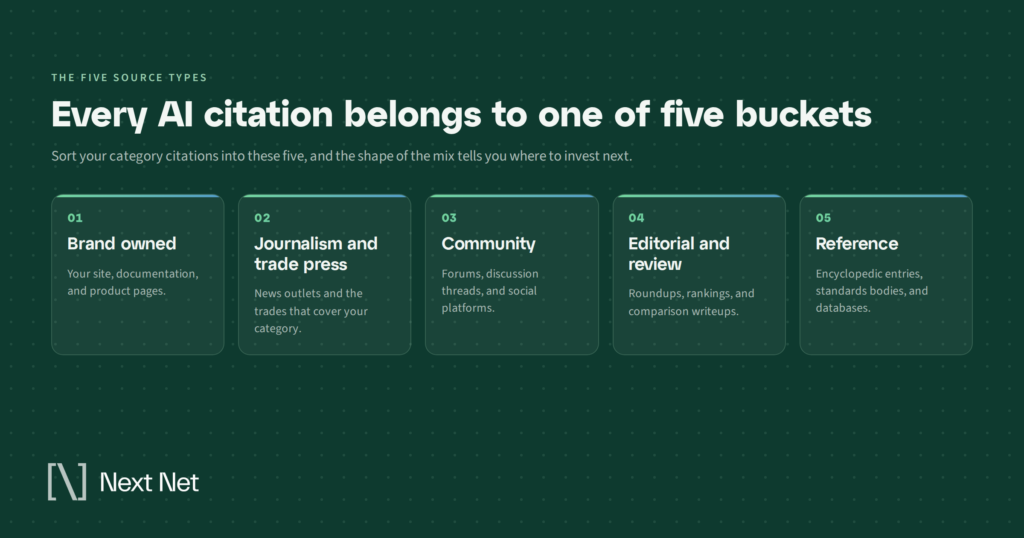
Five buckets cover most of it.
Brand-owned is your site and your competitors’ sites: product pages, documentation, blog posts, help centers. Journalism and trade press is reported coverage, from national outlets down to the trade publication that eleven people in your industry read religiously. Community is forums, question-and-answer sites, and social platforms where people talk to each other rather than to an audience. Editorial and review is the comparison sites, roundups, and buyer’s guides that exist specifically to evaluate options. Reference is encyclopedic and institutional material, including standards bodies, government pages, and academic sources.
The proportions between those five buckets are not fixed. They move by category, by engine, and by the kind of question being asked. That is the whole point, and it is why a single industry-wide benchmark cannot do the work people want it to do.
What the cross-category numbers say
Start with the benchmark anyway, because it establishes the shape of the terrain before we complicate it.
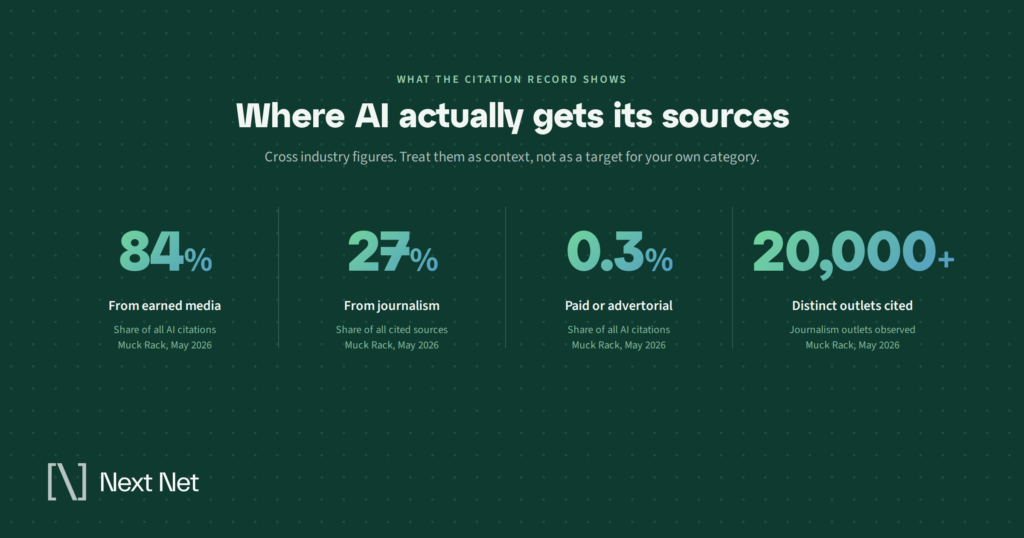
Muck Rack’s Generative Pulse team publishes a recurring study called *What Is AI Reading?*. The May 2026 edition analyzed more than 25 million links cited across ChatGPT, Claude, and Gemini responses in 17 industries.
Earned media accounted for 84% of all citations in that dataset. Journalism on its own accounted for 27%. Paid and advertorial content accounted for 0.3%.
The stability is the more interesting finding. Across three editions of the study going back to July 2025, earned media has stayed in a band between 82% and 89%, and journalism citations have held between 25% and 27%. Patterns that survive three model generations and a year of platform churn are describing something structural rather than a moment.
So the shape of the terrain is clear enough. Third-party coverage carries far more citation weight than anything you publish about yourself, and paid placement carries almost none.
What that does not tell you is where the 84% goes in your category, which outlets it goes to, or how much of it is contestable. Those are the questions that determine budget.
Every engine is a different room
The first reason the benchmark does not transfer is that the engines do not agree with each other.
Ahrefs looked at the 50 most-mentioned websites for Google AI Overviews, ChatGPT, and Perplexity across roughly 76.7 million AI Overviews and about 950,000 prompts on each of the other two platforms. Only seven of those sites appeared in the top 50 for all three. That study ran on June 2025 data, so treat the specific lists as a snapshot rather than a current standing, but the structural finding has held up across everything published since.
Fourteen percent overlap is not a rounding difference. It means the source mix you would build from ChatGPT data and the source mix you would build from Perplexity data are describing substantially different worlds.
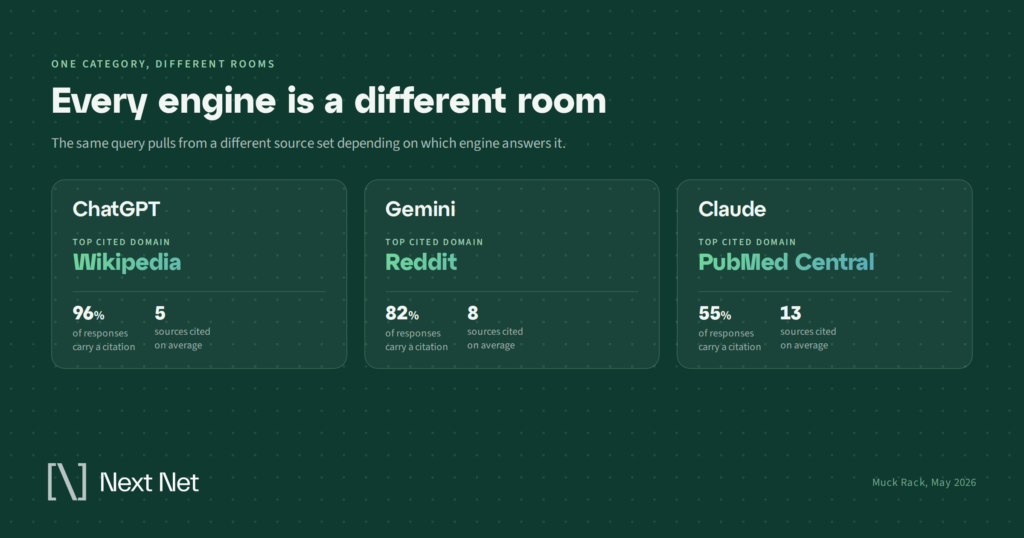
The behavioral differences underneath are just as wide. In the Muck Rack data, ChatGPT cited sources in 96% of responses but averaged only five citations per response. Gemini cited in 82% of responses and averaged eight. Claude cited in 55% of responses but averaged 13 sources when it did.
The single most-cited domain differed on every platform: Wikipedia for ChatGPT, PubMed Central for Claude, Reddit for Gemini.
Read that as three different editorial philosophies. One engine reaches for encyclopedic consensus, one reaches for institutional literature, one reaches for what people said to each other. A brand optimized for one of those is not automatically visible in the others.
This is where the scenery distinction starts to matter. Being present in a reference source often puts you in the scenery of an answer, named as part of the landscape. Being present in an editorial comparison is what puts you in the recommendation itself. Same brand, same week, different function depending on which source type carried it.
Category and question type move the mix again
The second reason the benchmark does not transfer is that even within one engine, the mix shifts based on what is being asked.
Muck Rack found that industry trend questions drive journalism citations at more than double the rate of how-to questions. Press releases turn up almost exclusively in trend-style responses, at 3.5 times the rate they appear in best-of queries.
Think about what that means operationally. If your buyers mostly ask AI engines comparison questions, journalism investment will underperform relative to the headline benchmark, because comparison questions pull disproportionately from editorial and review sources. If your buyers ask category-definition questions, the reverse is true.
The outlet-level picture is similarly uneven. Journalism citations in the Muck Rack dataset spanned more than 20,000 distinct outlets, which is a long tail by any measure. But one outlet, Axios, appeared in ChatGPT’s top three cited domains in 13 of the 17 industries studied.
Both facts are true at once, and holding them together is the skill. There is a small set of outlets that carries weight nearly everywhere, and there is a very long tail where category-specific publications do the real work. Your category sits somewhere on that spectrum, and you cannot know where without looking.
The practical move here is to stop measuring your category as a single block. Split the questions into the stages your buyers move through: what is this, which options exist, which one is right for me, and is this vendor any good. Run the source mix separately for each group. Most brands discover that they are well represented in the first stage, where reference and trade coverage does the work, and thin in the third, where editorial comparisons decide who gets named. That gap is invisible in an aggregate read and expensive to leave open.
The ranking overlap question
There is a related question that comes up in every one of these conversations: can I just use my organic ranking data as a proxy?
The evidence on that has moved considerably, and it is worth walking through because the contradiction is instructive rather than disqualifying.
In July 2025, Ahrefs studied 1.9 million citations from 1 million AI Overviews and found that 76.10% of cited pages ranked in the top 10 for the same query. Only 14.40% did not rank in the top 100 at all. The reasonable conclusion at the time was that AI Overview citation and organic visibility overlapped heavily.
An updated Ahrefs analysis of 863,000 keywords and 4 million AI Overview URLs, reported in March 2026, put that figure at 38%. The remaining citations split almost evenly between positions 11 to 100 and pages outside the top 100 entirely. A separate BrightEdge analysis using different methodology put the overlap closer to 17%.
Ahrefs was careful about the comparison, and you should be too. The company noted that its citation parsing improved between the two studies, which means some of the drop reflects better detection rather than a pure change in engine behavior. It also pointed to query fan-out, where a single search is split into multiple sub-queries and citations are drawn from across all of them.
So the range across credible 2026 measurements runs from roughly 17% to 38%, against 76% a year earlier. Even taking the most conservative reading of that spread, the direction is not ambiguous: your ranking set and your citation set have come apart, and one cannot stand in for the other.
One more detail from that dataset makes the point concretely. Among AI Overview citations that did not rank in Google’s top 100 for the same keyword, 18.2% were YouTube URLs. Format matters, not just domain authority.
How to read your own source mix
Once you have citation data for your category, there are five reads worth doing, in this order.
Read the dominant type first. Which of the five buckets holds the largest share of citations for your category’s questions? That number, not the industry average, is your baseline. A category where editorial comparison sites take 40% of citations calls for a completely different plan than one where trade press takes 40%.
Read the concentration. Is the citation share spread across dozens of domains or held by a handful? Concentrated mixes are harder to break into and more durable once you are in. Distributed mixes reward volume and breadth. This single measurement changes the shape of a program more than almost anything else.
A rough test: count how many domains it takes to reach half of the citations in your category. If the answer is three or four, you are working a concentrated mix, and a program built on volume will burn budget without moving the number. If it takes twenty or thirty, you are working a distributed mix, and a program built on winning two flagship placements will look successful in a report and change nothing in the answers.
Read the engine spread. Pull the mix separately for ChatGPT, Gemini, Perplexity, Copilot, and Google AI Overviews rather than averaging them. Where the mixes agree, you have a durable investment. Where they diverge sharply, you have a decision to make about which engine your buyers use.
Read the outlet list, not just the categories. Bucket-level percentages tell you where to invest. Named outlets tell you what to pitch. If the same four trade publications carry most of the journalism citations in your category, that is a media list, and it is a much shorter one than your PR agency is probably working from.
Read the movement. A source mix is a moving picture. Take the same measurement at intervals and watch which buckets grow. A category shifting from reference-heavy toward editorial-heavy is a category where buyer intent is maturing, and that shows up in the citation data before it shows up in your pipeline.
Turning the read into an investment decision
Each of those reads points at a different action, and the mapping is reasonably direct.
If brand-owned content holds a meaningful share of citations in your category, your own site is doing work, and the priority is depth and structure on the pages that already get pulled. This is the case Google’s own guidance addresses most directly. Google’s guide to optimizing for generative AI features, published in May 2026, takes the position that optimizing for generative AI search is optimizing for the search experience, and that no new machine-readable files or special markup are required. If your mix says owned content matters in your category, that guidance is the right playbook.
If journalism dominates, the work is media relations against a named list rather than broad distribution. The 20,000-outlet tail in the aggregate data is a distraction when your category’s citations concentrate in six publications.
If editorial and review sites dominate, the work is getting evaluated: inclusion in comparison content, buyer’s guides, and category roundups. These are the sources most likely to carry an actual recommendation rather than a passing mention, which makes them disproportionately valuable relative to their citation count.
If community sources dominate, the work is different again, and slower. You cannot place content in a forum the way you place a byline. You can be worth talking about, and you can participate in good faith where that is welcome.
And if reference sources dominate, the work is entity hygiene: making sure the encyclopedic and institutional record about your company is accurate, current, and consistent, because that record is doing a lot of the talking.
Notice that four of those five conclusions are invisible if all you have is the 84% benchmark. Mentions are scenery; the source that carries the recommendation is the revenue.
Frequently asked questions
What is an AI citation source?
An AI citation source is any web page an AI engine retrieves and attributes when building an answer. Sources differ from mentions: a source is a document the engine pulled and pointed at, while a mention is your brand name appearing in the answer text, which can happen with or without a citation attached.
How often does the source mix in a category change?
Often enough that a single measurement has a short shelf life. Ahrefs’ own top-10 overlap figure moved from 76% to a 17% to 38% range across roughly eight months of 2025 and 2026 measurements, and individual domain shares have moved faster than that. Quarterly measurement is a reasonable floor for most categories, monthly if your category is news-sensitive.
Should I measure each AI engine separately or combine them?
Separately, then combine. The Ahrefs overlap analysis found only seven shared domains among the top 50 for AI Overviews, ChatGPT, and Perplexity, so a combined average hides the differences that matter most. Measure ChatGPT, Gemini, Perplexity, Copilot, and Google AI Overviews individually, then weight them by where your buyers spend time.
Does my organic ranking data tell me anything about my citation sources?
Less than it used to. The measured overlap between AI Overview citations and organic top-10 rankings has declined substantially since mid-2025, with credible 2026 studies putting it between 17% and 38%. Rankings remain worth having, and Google’s guidance holds that search fundamentals still apply, but ranking data is no longer a usable proxy for citation data.
Is earned media always the highest-return investment?
Not always, and this is exactly why the category-level read matters. Earned media dominates the cross-industry average by a wide margin, but the mix varies enough by category, engine, and question type that the aggregate should never be treated as a forecast for a specific brand. Measure first.
The short version
The benchmark tells you what the terrain looks like from orbit. Your category’s source mix tells you where to put your feet.
Both are worth having, but only one of them changes what you do on Monday. Pull the citation data for the questions your buyers are asking, break it out by source type and by engine, and let the distribution tell you where authority is concentrated before you commit another quarter of budget to a channel the answers in your category do not draw from.
If you want to see the source mix for your own category, start with a report card on where you stand today.
Related Articles
You ask an engine a question in your category. Your brand comes up. That feels like a win, right up…


Most teams working on AI visibility end up holding two reports that never quite meet. One is a keyword export.…
Nine months into the engagement, the client asks the question you knew was coming. What did we get for this,…