

Dimensions: Your Topic and Facet Footprint, Ranked

A client looks at a single AI visibility number and asks the only question that matters. Where does that come from?
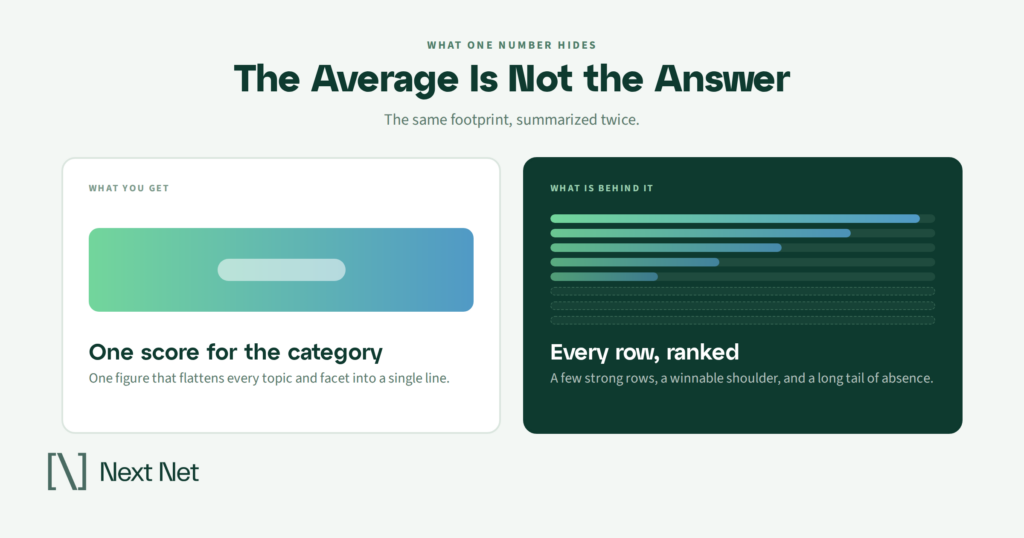
It is a fair question, and one percentage cannot answer it. A single figure covers an entire category. It cannot tell you whether you are moderately visible across everything or invisible almost everywhere and dominant in one corner. Those two brands can post the same headline number and need completely different work for the next six months.
The Dimensions view answers the question by refusing to average. It lists the subjects and attributes the engines associate with your category, ranks them by how visible you are on each, and shows the whole distribution rather than its midpoint. A few rows where you show up. A long run of rows where you do not.
This post is about reading that list: what separates a topic from a facet, why a zero is more ambiguous than it looks, why the ranking changes when you change engines, and the one mistake that turns a footprint report into a spam problem.
What a topic and facet footprint is
A topic and facet footprint is a ranked list of the subjects and attributes that make up your category, each scored by how often AI engines surface your brand when answering questions about it. Topics are the subjects buyers ask about. Facets are the qualifiers they attach to those subjects. The footprint is the full distribution across both axes, including every row where your score is zero. It measures breadth of presence, not the quality of any single answer.
That last clause matters. A footprint tells you how much of the conversation you appear in. It does not tell you whether appearing did you any good. A brand can occupy a wide footprint and still be scenery in every answer it turns up in, named in passing while a competitor gets the recommendation. Breadth and endorsement are different measures, and the footprint only reports the first.
Why one buyer question becomes many
The reason visibility spreads across so many rows is that AI engines do not answer the question you typed. They answer a cluster of questions derived from it.
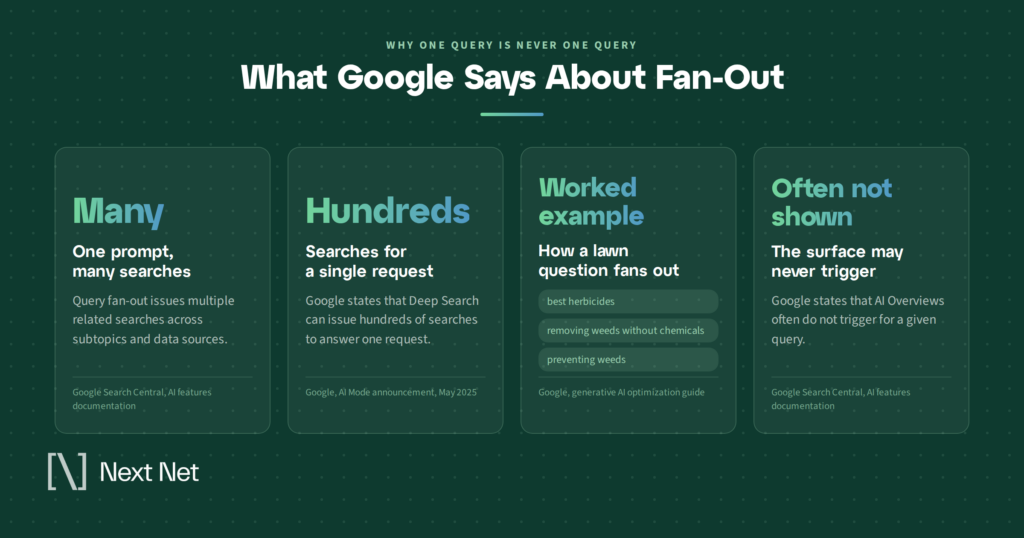
Google documents the mechanism plainly. In its guidance on AI features and your website, the company describes a query fan-out technique used by both AI Mode and AI Overviews, which issues multiple related searches across subtopics and data sources before composing a response. The stated purpose is to surface a wider and more diverse set of supporting links than a classic search would return.
The scale is larger than most teams assume. Google’s AI Mode announcement describes the technique as breaking a question into subtopics and issuing a multitude of queries simultaneously, and notes that its Deep Search capability can issue hundreds of searches for a single request.
Google’s guide to optimizing for generative AI features makes the shape concrete with a worked example. Someone asks how to fix a lawn full of weeds. The fan-out queries include best herbicides for lawns, removing weeds without chemicals, and preventing weeds in the first place.
Read that example again, because it is the whole argument for the second axis. One topic went in. Three facets came out, and they are not interchangeable. A brand that sells herbicide is well placed for the first and structurally absent from the second. The buyer never typed the word chemical-free. The engine supplied it.
Topics and facets are different axes
Most visibility reporting stops at the topic. That is the coarse axis, and it flatters you.
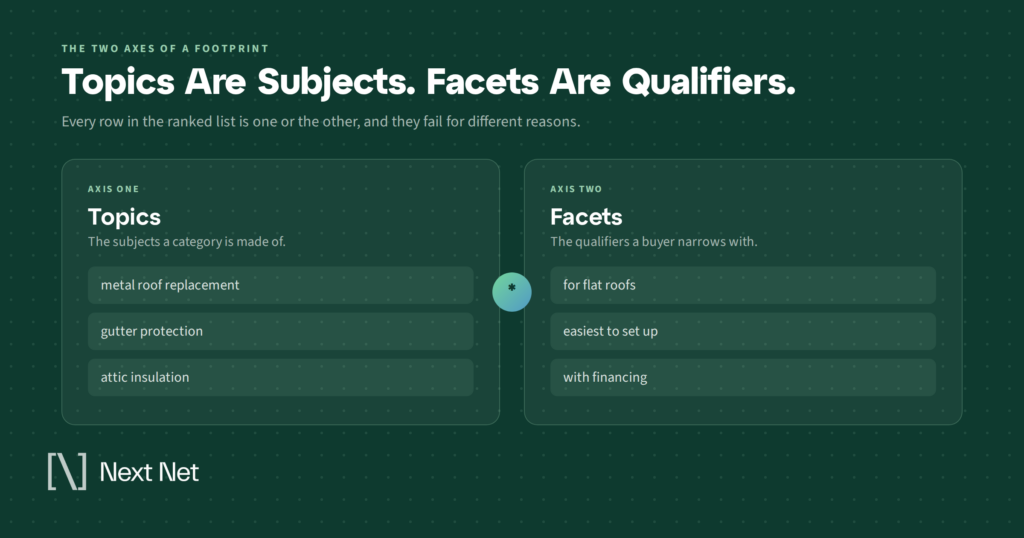
A topic is a subject: project management software, commercial roofing, retirement planning. A facet is the qualifier a buyer attaches when the question gets real: for small teams, for flat roofs, for people retiring early, cheapest, easiest to set up, best support, most secure.
Topic-level visibility answers whether the engines know what business you are in. Facet-level visibility answers whether they know who you are for. The second question is where deals are won, and it is where footprints are usually thin.
The pattern repeats across categories. A brand shows solid visibility on its core topic and near zero on the facets that carry purchase intent. It is present for the category and absent for the decision, which is another way of saying it is scenery exactly where the money is.
This is also why a footprint can look healthy while pipeline does not move. Appearing on broad subject questions puts you in the room. Appearing on qualified questions puts you in the shortlist. A report that only counts topics will show you the room and let you assume it is the shortlist.

How to read the ranked list
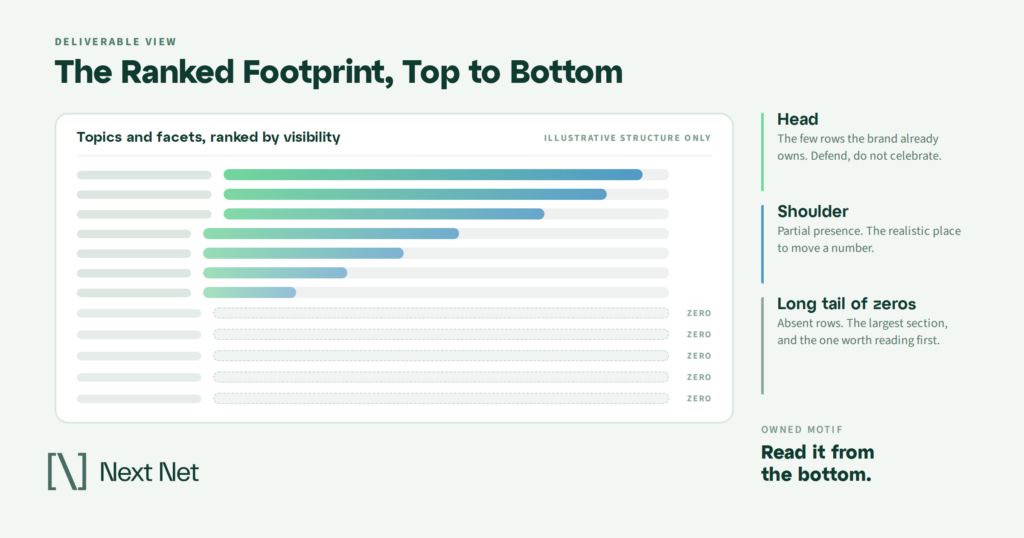
The list sorts high to low, which means it opens with your best rows. Read it from the bottom instead.
The top of the list is the part you already know. Those are the subjects you have written about for years, the ones your sales team assumes you own. Confirming them is reassuring and rarely changes a decision.
The bottom of the list is the product. It is the inventory of questions your category is being asked where your brand does not come up at all, not even as scenery. Nothing else in a visibility report gives you that inventory in one place.
Between the two sits the part worth the most attention. Call it the shoulder: rows where you appear sometimes, inconsistently, usually alongside several other brands. Those rows are contested rather than lost. They tend to respond to work faster than the zeros do, because the engines already associate you with the subject and simply do not do it reliably.
So the practical read runs bottom, middle, top. Start with what is missing, move to what is unstable, and finish by confirming what is already working.
How to read a zero
A zero row is the most useful thing in the report and the easiest to misread. It supports at least four different explanations, and they call for different responses.
The first is real absence. The engines are answering that question regularly and never reaching for you. This is the actionable case, and it is the one people assume every zero represents. It is also the minority of rows on most reports.
The second is a thin sample. That row may rest on a small number of observations. Direction is readable at that size; precision is not. A row built on a handful of runs should be treated as a signal to look closer, not as a measurement.
The third is that the surface did not appear. Google notes in its documentation that AI Overviews are shown only when its systems judge them additive to classic search, and as such often do not trigger at all. A zero can reflect an answer that was never generated rather than an answer that excluded you.
The fourth is that the row does not belong to you. Category maps are generated, and generated maps include adjacent subjects your business does not serve. A roofing contractor is not failing at solar panel financing. Scoring zero on a question you would never want is not a gap, and treating it as one is how teams end up building content for buyers who do not exist.
Sorting zeros into those four buckets is the single highest value hour anyone spends with this report. It is also the step most often skipped, because the list is long and the temptation is to treat every empty row as a task.
Why the same footprint ranks differently on each engine
Run the same category across ChatGPT, Gemini, Perplexity, Copilot, and Google AI Overviews and the ranked lists will not match. This surprises people who expect a footprint to be a property of the brand rather than a property of the reading.
Part of the answer comes from Google directly. Its documentation states that AI Mode and AI Overviews may use different models and techniques, so the responses and links they show will vary. If two surfaces inside one company diverge, five systems built by different companies on different retrieval stacks will diverge considerably more.
The practical consequence is that a single-engine footprint is a sample, not a census. A brand can hold a respectable position on one engine and sit near the floor on another, and both readings are accurate about the surface they describe.
This is why the rows to act on first are the ones that read low across several engines at once. Consistency across independent systems is the closest thing to a reliable signal that the absence is real rather than an artifact of how one engine happened to retrieve that day.
Turning the ranked list into a shortlist
A footprint report is not a work plan. It is the raw material for one, and the conversion takes four passes.
First, cut the rows that are not yours. Work down the zeros and strike every subject your business does not serve. On a generated category map this often removes a meaningful share of the list, and everything after this step gets faster.
Second, separate topics from facets. Group what remains by which axis it sits on. Missing topics and missing facets are different problems: a missing topic usually means there is nothing to retrieve, while a missing facet often means the material exists but never states the qualifier in terms an engine can pick up.
Third, check each candidate against real demand. A row can be truly absent and still not be worth a page, because nobody is asking. The footprint measures presence, not demand, so pair it with demand data before anything reaches a calendar.
Fourth, look at what you already have. A surprising share of missing facets are covered somewhere on your site in language no engine would match, buried three headings deep in a page about something else. Surfacing an existing answer is cheaper and faster than commissioning a new one.
What survives four passes is a shortlist. It will be far shorter than the zero count you started with, and that shrinkage is the point.
The mistake that turns a footprint into a spam problem
There is an obvious move once you have a list of every question you are missing from. Build a page for each one.
Google names that move specifically and warns against it. Its generative AI guidance addresses the temptation to create separate content for every possible variation of how people might search, including fan-out queries, and states that doing so primarily to influence rankings or AI responses violates the scaled content abuse spam policy. The same guidance calls it an ineffective long-term strategy, on the grounds that a high quantity of pages does not make a site more relevant.
The same document reassures site owners on the related worry, telling them not to fret about failing to capture every long-tail variation, because these systems understand synonyms and general meaning rather than requiring an exact match.
Read together, those two passages define how to use a footprint report responsibly. The zeros are diagnostic. They tell you where the engines do not associate you with a subject, which is a real finding about your content and your evidence base. They are not a content brief, and a report with three hundred empty rows is not an instruction to publish three hundred pages.
The defensible response to a cluster of missing facets is usually one substantial piece that addresses the qualifier properly, not a page per phrasing. Depth on the qualifier beats coverage of its variants.
What this report does not tell you
Every measure has a boundary, and stating this one keeps the report honest in a client meeting.
It does not tell you whether being present helped. Presence and endorsement are separate, and a brand can hold a broad footprint while remaining scenery in the answers it appears in. Reading whether engines link to you or merely say your name is the job of the citation footprint.
It does not give you a single figure for the boardroom. That is the aggregate AI share of voice, which compresses this entire distribution into one number and is worth reading alongside the distribution it came from rather than instead of it.
It does not sequence the work. Pairing visibility with demand so you can prioritize is what the topical map is for, and it is the natural next stop once you have a shortlist.
It does not tell you who you are being grouped with. Co-appearance, meaning which brands turn up beside you and what that implies about your positioning, sits in the market atlas.
One more boundary is worth naming out loud. Google is direct that no third-party tool has access to its internal ranking or AI systems. Any footprint, from any provider, is an observation of published answers rather than a readout of an engine’s internals. That is a reason to report direction and pattern rather than precision, and it is the standard this series holds itself to.
Frequently asked questions
What is a topic and facet footprint in AI search?
A topic and facet footprint is a ranked list of the subjects and attributes in your category, scored by how often AI engines mention your brand when answering questions about each. Topics are subjects such as commercial roofing. Facets are the qualifiers buyers attach, such as for flat roofs or fastest turnaround. The footprint shows your presence across both, including every row scored at zero.
How do I check my brand’s AI visibility across topics?
Ask the engines the questions your buyers ask, across all five surfaces, in clean sessions without prior conversation history, and record whether your brand appears. Doing this by hand gives you a usable spot check on ten or twenty questions. Covering a full category with topics and facets, repeatedly and consistently enough to compare over time, is where a measurement platform earns its place.
What does it mean if a topic shows zero visibility?
It means one of four things, and they are not equally useful. The engines may never surface you for that subject at all. The row may rest on too few observations to read. The AI surface may not have appeared at all, since Google says AI Overviews often do not trigger. Or the row may be an adjacent subject your business does not serve. Sort a zero into one of those buckets before treating it as a gap.
Why does my AI visibility differ from one engine to another?
Because ChatGPT, Gemini, Perplexity, Copilot, and Google AI Overviews are different systems retrieving from different sources with different models. Google states that even AI Mode and AI Overviews, both its own products, may use different models and techniques and therefore show different responses and links. Divergence across independent engines is expected, which is why a low reading on one engine is a prompt to check the others rather than a conclusion.
How many topics should a brand try to cover?
Fewer than the report implies. Breadth for its own sake works against you, and Google’s guidance is explicit that a high quantity of pages does not make a site more relevant. Depth on the subjects and qualifiers your buyers use will move a footprint further than thin coverage of everything in the category.
Start at the bottom
The value of a ranked footprint is not the ranking. It is the length of the list, and the fact that most of it is empty.
A single visibility percentage lets everyone in the room nod and move on. The distribution behind it does not, because it puts the questions you are missing from on the same page as the ones you own, and makes the ratio between them impossible to look away from.
Read it from the bottom, throw out the rows that are not yours, and take a shortlist rather than a backlog into the next planning meeting. If you want to see the shape of your own footprint before deciding what to do about it, the AI Visibility Report Card is the fastest place to start, and the platform is where the full ranked view lives.
Related Articles

Your AI visibility number went up last quarter. Now answer the harder question. At what point in a buying decision…
