
Why Citations Belong Next to Pageviews in Your Reporting

Your monthly traffic report is still accurate. It has just stopped describing your audience.
Sessions are down and search referrals are down further. The chart tells you what happened without telling you where the readers went, because a growing share of them got what they needed from an answer that quoted you and never sent them anywhere. That reader exists. Your reporting cannot see them.
This post is about the column that fixes it. Not a replacement for traffic, a companion to it: how to measure AI search visibility next to the numbers you already report, which figures earn a place in the deck, where citation slots come from, and how to read the two columns together when they disagree.
What AI Search Visibility Metrics Measure
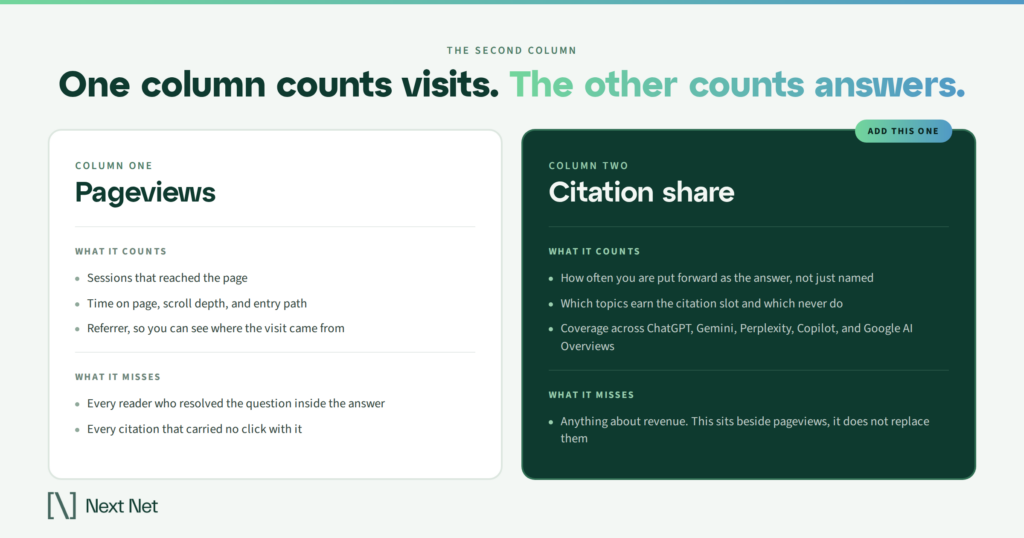
AI search visibility metrics measure how often, and in what role, AI engines surface your brand or your pages when they answer questions in your category. They cover two separate events. A citation is when an engine links or attributes a specific page. A recommendation is when an engine puts you forward as the answer rather than as background. Traffic metrics count the people who arrived on your site. Visibility metrics count the answers you appeared in, whether or not anyone clicked.
The distinction between those two events is the whole reason the metric is worth adding. A publisher can hold steady on citation volume while losing every recommendation in the category, and nothing in a traffic report will say so.
Your Traffic Report Stopped Describing Your Audience
The shift is documented rather than anecdotal.
The Reuters Institute published its Digital News Report 2026 in June, built on roughly 97,000 interviews across 48 markets. For the first time in the survey’s history, social media and video networks passed news organizations’ own websites and apps as a way of accessing news globally, at 54 percent against 51 percent.
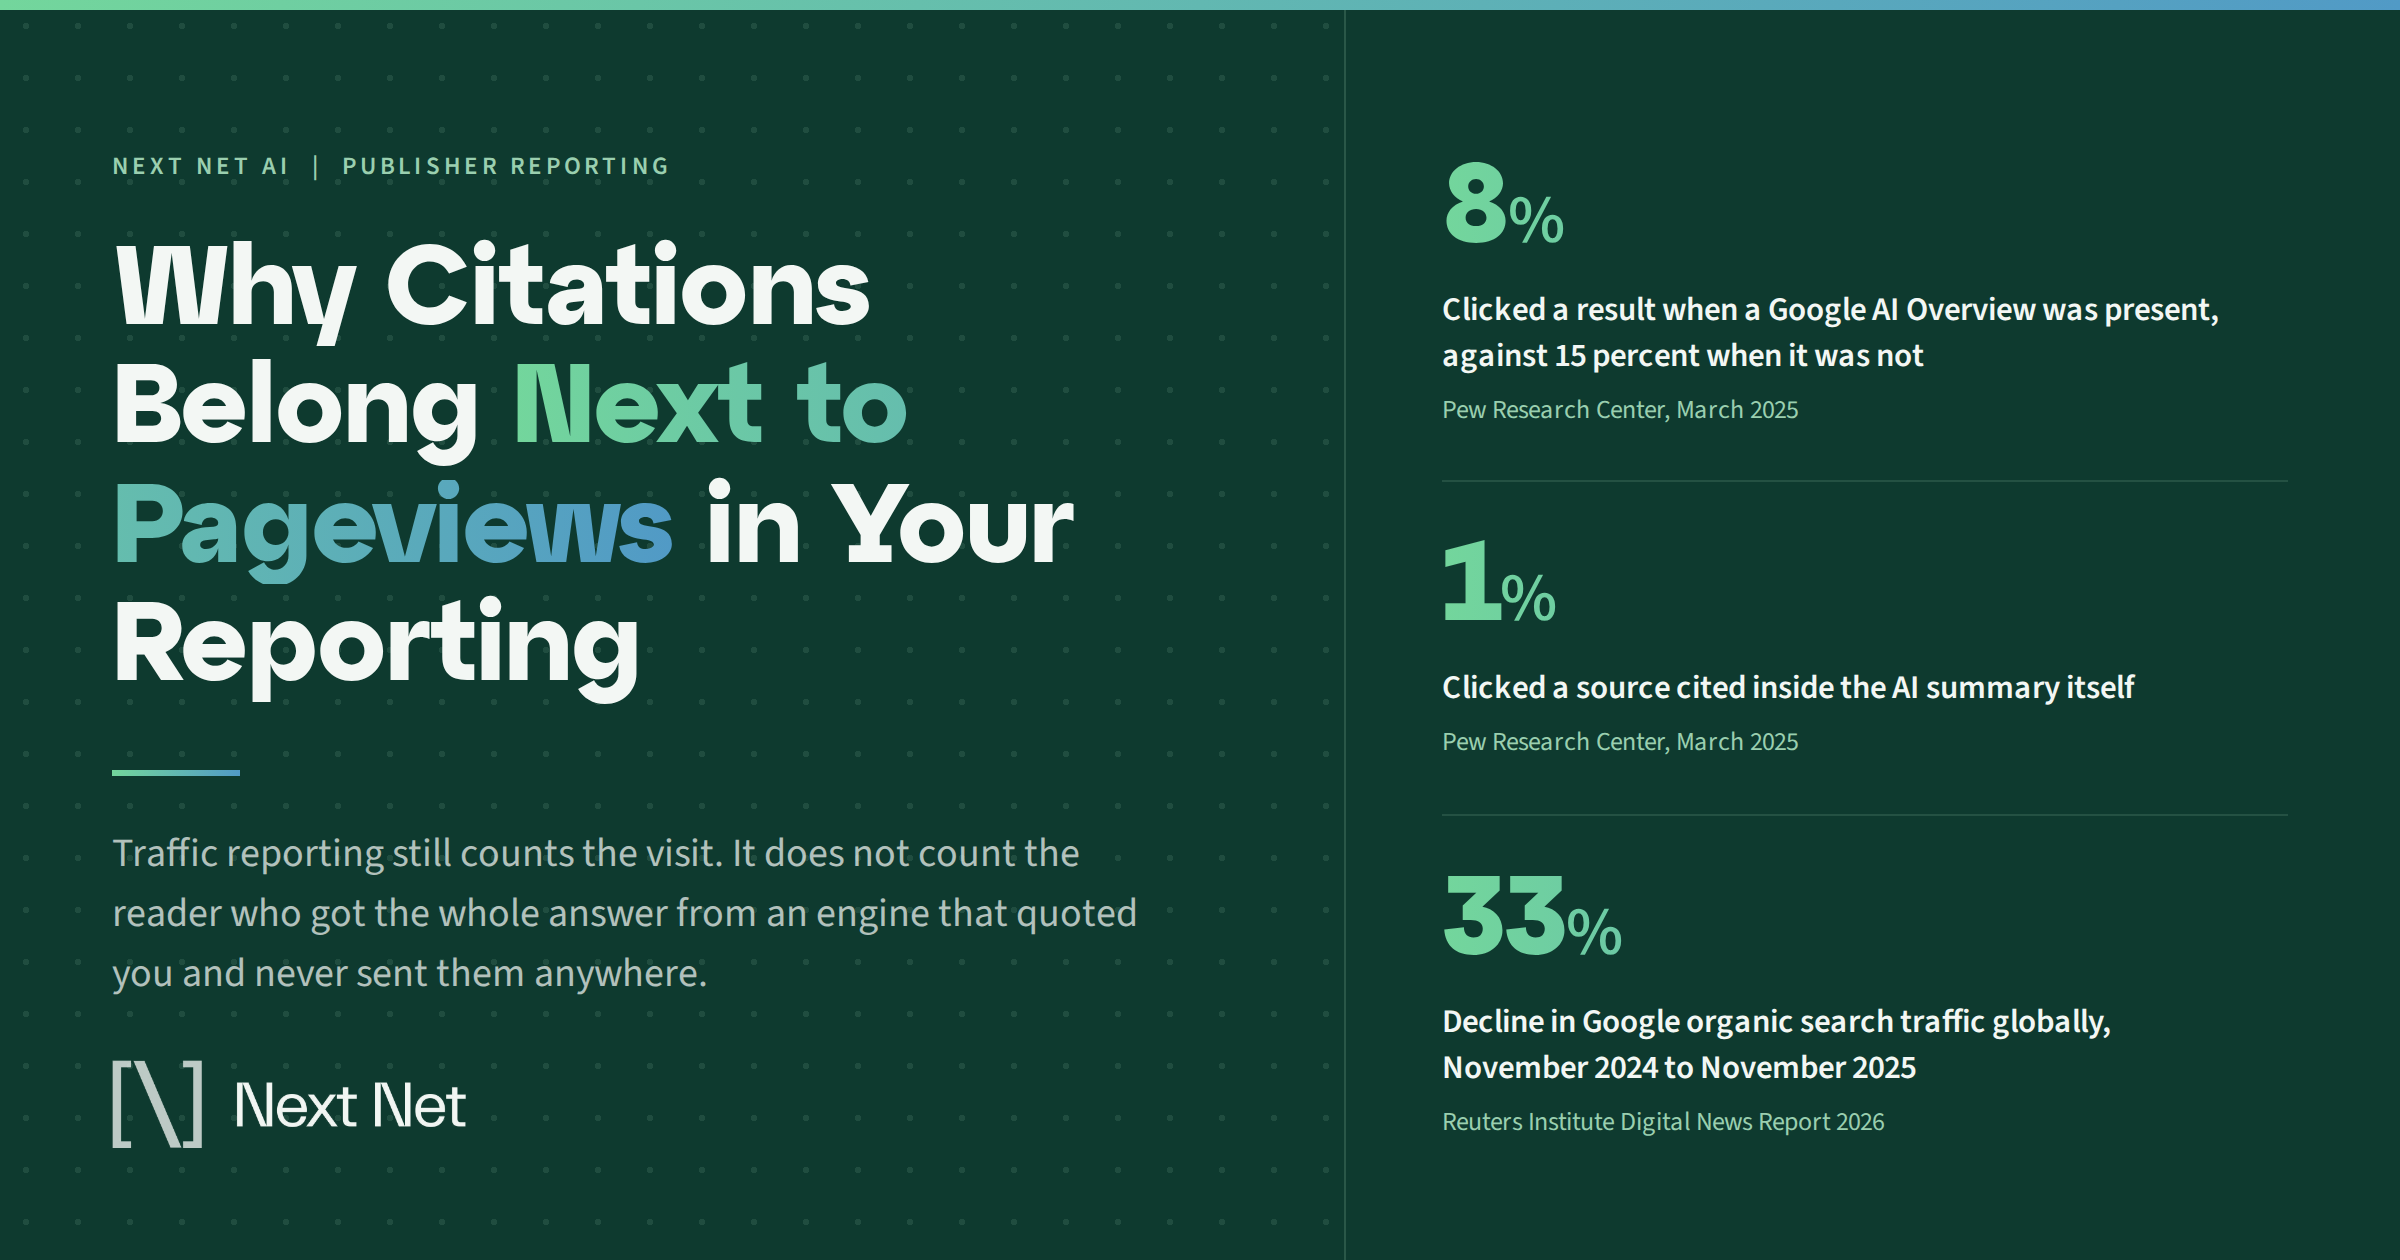
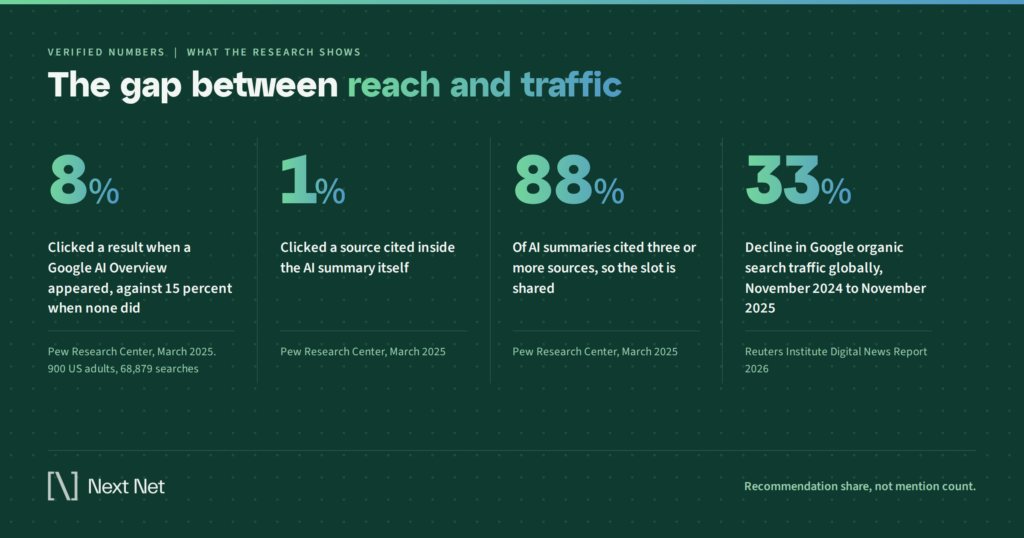
Reach for owned news sites and apps has fallen 12 percentage points since 2021. The report also carries aggregate figures from an analytics provider showing that Google organic search traffic to more than 2,500 sites dropped by about a third globally between November 2024 and November 2025, and by 38 percent in the United States. Publishers surveyed expect search referrals to fall a further 43 percent over the next three years.
None of those numbers tell you whether the audience stopped caring about your coverage or simply stopped needing to visit to read it. That is a reporting gap, not an audience verdict.
Weekly use of AI chatbots for news reached 10 percent globally, up from 7 percent the year before, and 16 percent among people under 35. The absolute share is small. The direction is consistent, and the people doing it are the most engaged segment of the audience: 38 percent of them fall into the report’s news lover category, against 22 percent of respondents overall.
Those are the readers a publisher can least afford to lose track of.
A Citation Is Not a Click, and That Is the Point
Two credible datasets say near opposite things about whether AI answers send people onward.
Pew Research Center tracked the browsing of 900 US adults across nearly 69,000 Google searches during March 2025. When an AI summary appeared, users clicked a traditional search result in 8 percent of visits, against 15 percent of visits with no summary. Clicks on the sources cited inside the summary happened in 1 percent of visits. Users were also more likely to end the browsing session entirely, on 26 percent of pages with a summary against 16 percent without.
Now set the Reuters Institute figure beside it. Among people who use AI chatbots for news, 42 percent say they always or often click through to the original source, close to the 44 percent who say the same about search engines and above the 36 percent for social media.
One percent and 42 percent. Both figures are sound and neither is wrong.
They measure different things. Pew observed real browsing on Google AI Overviews. Reuters asked people to describe their own behavior in standalone chatbots, and cautions in the report that its comparison covers quite different user bases. Different surface, different instrument, different question.
That gap is the argument for a separate metric. If click data cannot tell you what a citation was worth, click data cannot be the only thing in the report. At some point you have to count the citation itself.
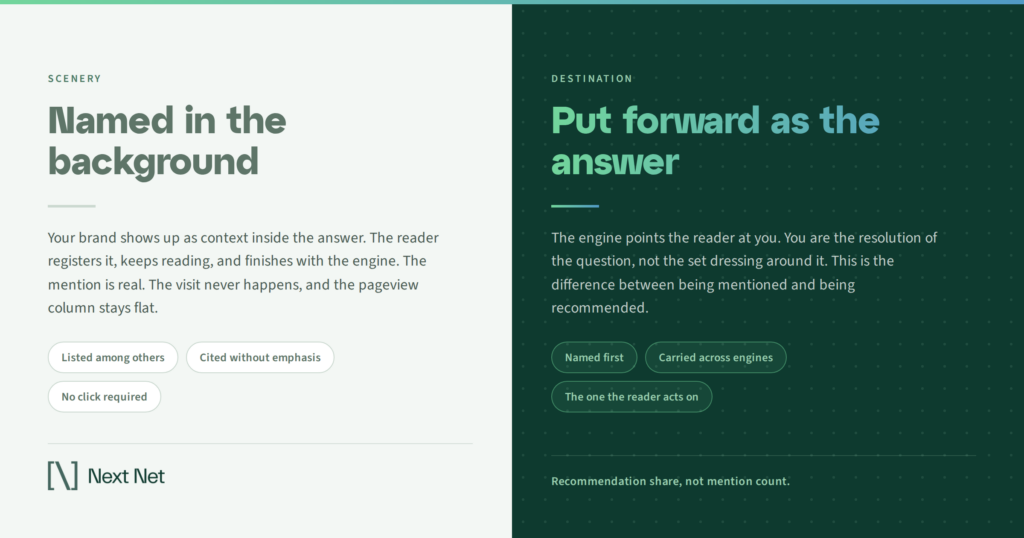
Being named in an answer is not the same as being the answer. A brand quoted for background is scenery. A brand put forward as the recommendation is the destination. Both register as a mention, and only one of them moves a reader.
Scenery gets described. Destinations get chosen.
The Four Numbers Worth Putting Next to Pageviews
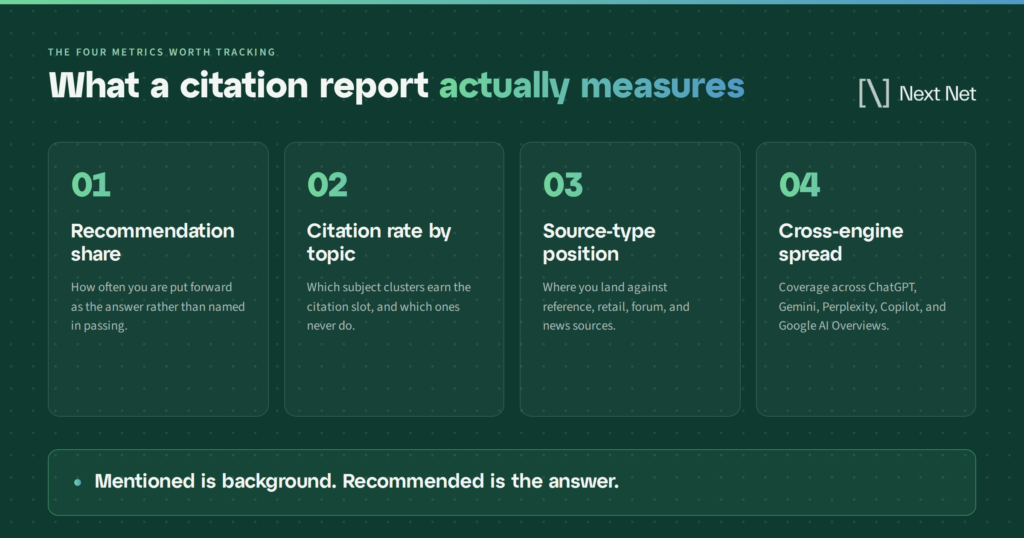
You do not need a new dashboard with forty tiles. Four figures carry most of the signal, and all four can sit on the page you already send around every month.
Recommendation share, not mention count
Raw mention counts inflate easily. An outlet that gets named in passing in every answer about a category will post a large number and win nothing.
Report instead the share of answers in which you were the recommended source, expressed against the total answer set for that topic. It is a smaller number and a more honest one. It is also the figure that moves when your coverage improves rather than when the category gets noisier.
Citation rate by topic
Sitewide visibility is close to meaningless for a publisher covering more than one beat. You can own a category outright and sit at zero on the beat next to it, and the blended average will show neither.
Break the number out by topic or section. The topics where you sit near zero are the actionable ones, and they are invisible in any sitewide figure.
Source-type position
Engines pull from a mix of source types when they answer, and the mix varies by question. Knowing whether your category’s answers lean on reference sites, community forums, government pages, or original reporting tells you what kind of asset earns a slot there.
This is the number that tells an editor what to commission, which makes it the one most likely to survive contact with a newsroom.
Cross-engine spread
The same question asked of ChatGPT, Gemini, Perplexity, Copilot, and Google AI Overviews will not return the same sources. Visibility concentrated in a single engine is fragile in the same way that traffic concentrated in a single referrer is fragile.
Track the spread and report it plainly. If four of your five engines never surface you on a core topic, that is the finding, and no aggregate score should be allowed to smooth it over.
Where the Citation Slots Come From
Citation share sounds abstract until you look at how the slots are allocated.
In the Pew dataset, about 18 percent of Google searches produced an AI summary. The vast majority of those summaries, 88 percent, cited three or more sources, and only 1 percent cited a single source. The typical summary ran 67 words, with a range from seven words to 369.
Three or more slots per answer is a meaningfully different competitive shape than a single blue link at position one. Being second choice still puts you in the answer.
The source mix is the part publishers tend to get wrong when they guess. Wikipedia, YouTube, and Reddit together accounted for 15 percent of the sources listed in AI summaries, and a similar 17 percent of sources in standard results. Government sites appeared more often in summaries than in standard results, at 6 percent against 2 percent. News websites held 5 percent of AI summary sources, and the same 5 percent of standard search results.
Read that last figure carefully, because it cuts against the common assumption. On this data, news sites were not being squeezed out of AI summaries relative to how often they appeared in ordinary results. Their slot share held. What changed was what a slot was worth in clicks.
That is a different problem from the one most publisher decks describe, and it calls for a different response.
Query shape drives slot supply too. Only 8 percent of one or two word searches produced a summary, rising to 53 percent for searches of ten words or more. Around 60 percent of searches starting with question words such as who, what, when, or why produced one.
Two caveats belong on these figures, and you should carry them into any deck that uses them. The data covers Google AI Overviews in March 2025, not chatbots, and not the current state of any engine. Google also does not generally enable AI answers for hard news queries, so the composition above reflects the wider question set rather than breaking news specifically.
Use it for direction and shape. Do not present it as your own current position.
Reading the Two Columns Together
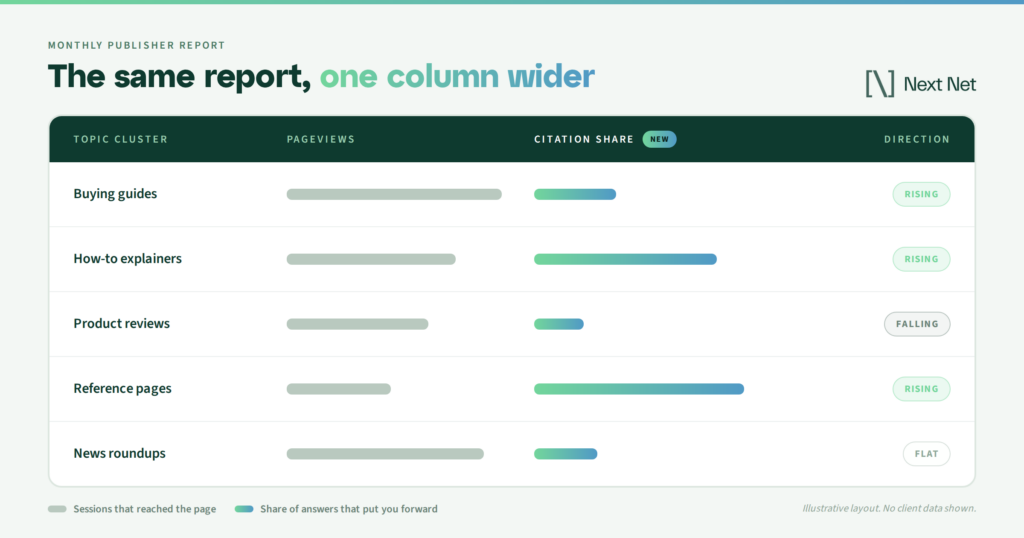
The reason citations belong beside pageviews rather than on a separate slide is that the two move independently, and the combination is more informative than either line alone.
Traffic up and citation share up is the uncomplicated case. Keep going.
Traffic down and citation share up is the reframe this whole post exists for. Your coverage is winning answers and losing clicks. The editorial direction is working and the monetization model attached to it is not, which is a commercial problem rather than a newsroom one. Reporting only the traffic line would have sent you to fix the wrong department.
Traffic up and citation share down is the borrowed traffic case. Something is sending readers now, often a single platform or a single story, and none of it is building standing in the answers. It tends to look healthy right up until the referrer changes its mind.
Both down is a topic problem, and the topic breakdown will usually name it inside an hour.
The quadrant a beat sits in should change what you do next. That is the test of whether a metric earned its place in the report, and scenery is the failure mode to watch for in the second and third cases: plenty of appearances, no standing.
Putting It in the Monthly Report
The practical build is less work than it sounds, provided you keep it disciplined.
Fix your prompt set and leave it alone. A stable list of the questions that matter in your category, re-run on the same cadence, is what turns a snapshot into a trend. Changing the questions between runs makes every comparison meaningless, and it is the most common way this goes wrong.
Report share, not counts. A share carries its own denominator, which makes it readable by someone who was not in the room when it was gathered.
Segment by topic before you report anything sitewide. Log the engine and the date on every figure, because both change underneath you.
Match the cadence to the volatility. Monthly is usually right for a publisher. Weekly measurement on a modest prompt set mostly produces run to run noise that reads like movement, and teaching a newsroom to react to noise is worse than not measuring at all.
On the content side, Google’s own guidance is that optimizing for its generative AI features is optimizing for search, and thus still SEO. There is no separate markup, machine readable file, or AI text file required to appear in AI Overviews or AI Mode. That is worth knowing before anyone proposes a technical project to solve a measurement problem.
What Does Not Belong in the Report
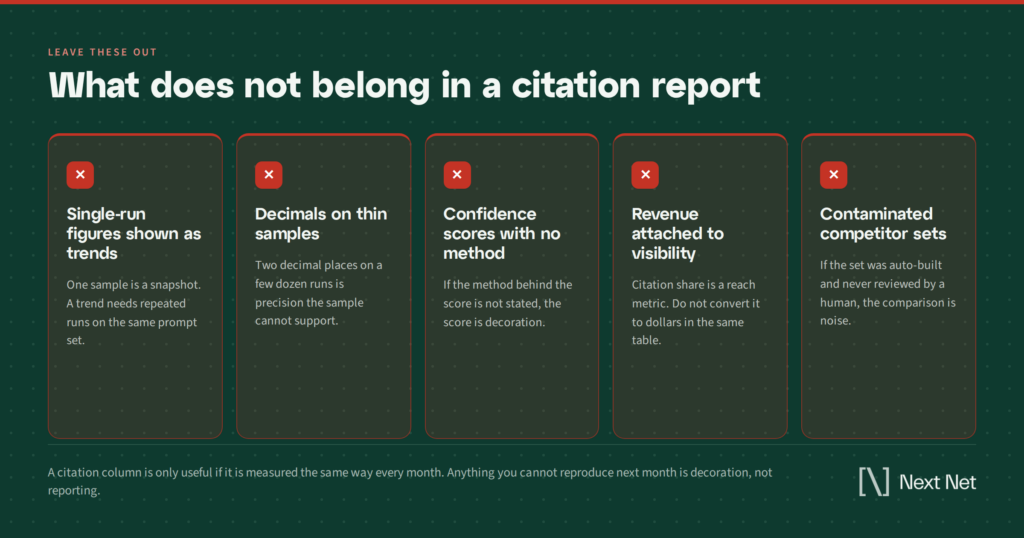
The failure mode for a new metric is not that nobody looks at it. It is that it arrives dressed up as more certain than it is, and a newsroom makes real decisions on it.
Keep these out.
Single run figures presented as trends. One pass over a prompt set is a sample, and engines return different sources to the same question on different days. Say how many runs are behind the number.
Decimal precision on thin samples. If a topic rests on a few dozen answers, a share to one decimal place is false confidence with a period in it. Round, or report the direction and skip the figure.
Confidence scores with no method behind them. If the same score appears next to every line, it is a default value rather than a calculation, and it should come out of the deck.
Revenue figures attached to visibility. Converting a citation share into a dollar range requires assumptions nobody has validated, and it invites a finance conversation the data cannot support.
Contaminated competitor sets. Answer sets return every domain an engine drew on, which includes aggregators, reference sites, and local pages that are not competing with you for anything. Clean arithmetic over a contaminated set produces percentages that look right and are not, which is harder to catch than an obvious error.
Where Next Net AI Fits
Next Net AI built Market Intel around the separation this post is arguing for: measuring whether engines recommend a brand or merely mention it, broken out by topic and by engine, rather than reporting one blended visibility number.
If you want to see the shape of that read against your own domain before committing to a measurement program, the AI Visibility Report Card is the short version.
For the editorial side of the question, our guides on how to get cited by AI and which sources AI trusts in your category cover what earns a citation slot once you can see where you stand.
Frequently Asked Questions
What is the difference between an AI citation and an AI mention?
A citation links or attributes a specific page, while a mention names the brand without pointing anywhere. Citations are traceable and can be tied back to a URL you control. Mentions build familiarity and cannot be followed. Reporting them as one number hides which of the two you are earning.
How often should publishers measure AI search visibility?
Monthly suits most publishers. It is frequent enough to catch a real shift and slow enough that run to run variation does not read as a trend. Weekly measurement on a small prompt set tends to produce noise rather than signal.
Do AI citations drive traffic to publisher sites?
Sometimes, and far less reliably than a search result does. Pew found clicks on sources cited inside Google AI summaries in about 1 percent of visits, while the Reuters Institute found 42 percent of chatbot news users say they often click through. The honest answer is that click value varies by surface, which is why citation share is tracked separately rather than converted into an estimated traffic figure.
Which AI engines should publishers track?
ChatGPT, Gemini, Perplexity, Copilot, and Google AI Overviews cover the surfaces most readers encounter. Track them separately rather than as a blended score, because the same question returns different sources on each one and the differences are the useful part.
Does AI search visibility require different content than SEO?
Google’s position is that optimizing for its generative AI features is still SEO, with no separate markup or AI specific files needed. What changes is measurement rather than craft. The content work is familiar and the reporting layer is what has to be rebuilt.
The Second Column
Nobody is asking you to retire the traffic report. It still measures something real, and for most publishers it still pays the bills.
What it no longer does is account for the whole audience. A reader who saw your reporting quoted in an answer and never arrived is a reader your analytics will never mention, and there are more of them every quarter.
Adding citation share next to pageviews is a small change to a document you already produce. It is also the difference between a report that tells you traffic fell and a report that tells you whether it fell because your coverage lost the argument or because the answer moved somewhere your counters do not reach.
Related Articles
On September 15, 2026, Cloudflare flipped a default that touches a large slice of the web. Training and Agent crawlers…

Every year or so a new file shows up at the root of publisher sites, and this cycle’s file is…
Every few weeks another headline lands: a publisher sues an AI company, an AI company calls the claim meritless, and…